

Deep Dive into Predictive Analytics Models and Algorithms


You leave for work early, based on the rush-hour traffic you have encountered for the past years, is predictive analytics. Financial forecasting to predict the price of a commodity is a form of predictive analytics. Simply put, predictive analytics is predicting future events and behavior using old data.
The power of predictive analytics is its ability to predict outcomes and trends before they happen. Predicting future events gives organizations the advantage to understand their customers and their business with a better approach. Predictive analytics tools comprise various models and algorithms, with each predictive model designed for a specific purpose.
Identifying the best predictive analytics model for your business is a crucial part of business strategy. For example, you wish to reduce the customer churn for your business. In that case, the predictive analytics model for your company will be different from the prediction model used in the hospitals for analyzing the behavior of the patients after certain medical operations.
You must be wondering what the different predictive models are? What is predictive data modeling? Which predictive analytics algorithms are most helpful for them? This blog will help you answer these questions and understand the predictive analytics models and algorithms in detail.
Predictive modeling is a statistical technique that can predict future outcomes with the help of historical data and machine learning tools. Predictive models make assumptions based on the current situation and past events to show the desired output.
Predictive analytics models can predict anything based on credit history and earnings, whether a TV show rating or the customer’s next purchase. If the new data shows the current changes in the existing situation, the predictive models also recalculate the future outcomes.
A predictive analytics model is revised regularly to incorporate the changes in the underlying data. At the same time, most of these prediction models perform faster and complete their calculations in real-time. That’s one of the reasons why banks and stock markets use such predictive analytics models to identify the future risks or to accept or decline the user request instantly based on predictions.
Many predictive models are pretty complicated to understand and use. Such models are generally used in complex domains such as quantum computing and computational biology to perform longer computations and analyze the complex outputs as fast as possible.
With the advancements in technology, data mining, and machine learning tools, several types of predictive analytics models are available to work with. However, some of the top recommended predictive analytics models developers generally use to meet their specific requirements. Let us understand such key predictive models in brief below:
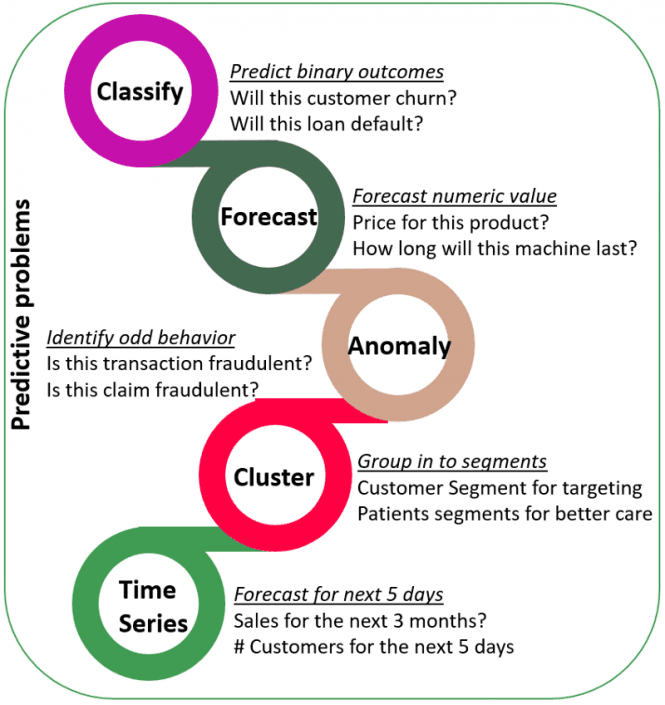
The classification models are the most simple and easy to use among all other predictive analytics models available. These models arrange the data in categories based on what they learn from the historical data.
Classification models provide the solution in “yes” and “no” to provide a comprehensive analysis. For instance, these models help to answer questions like:
When looking for any decisive answers, the classification model of predictive modeling is the best choice. The classification models are applied in various domains, especially in finance and retail industries, due to their ability to retrain with the new data and provide a comprehensive analysis to answer business questions.
As data collection may have similar types and attributes, the clustering model helps sort data into different groups based on these attributes. This predictive analytics model is the best choice for effective marketing strategies to divide the data into other datasets based on common characteristics.
For instance, if an eCommerce business plans to implement marketing campaigns, it is quite a mess to go through thousands of data records and draw an effective strategy. At the same time, using the clustering model can quickly identify the interested customers to get in touch with by grouping the similar ones based on the common characteristics and their purchasing history.
You can further divide the predictive clustering modeling into two categories: hard clustering and soft clustering. Hard clustering helps to analyze whether the data point belongs to the data cluster or not. However, soft clustering helps to assign the data probability of the data point when joining the group of data.
The forecast model of predictive analytics involves the metric value prediction for analyzing future outcomes. This predictive analytics model helps businesses for estimating the numeric value of new data based on historical data.
The most important advantage of the forecast predictive model is that it also considers multiple input parameters simultaneously. It is why the forecast model is one of the most used predictive analytics models in businesses. For instance, if any clothing company wants to predict the manufacturing stock for the coming month, the model will consider all the factors that could impact the output, such as: Is any festival coming by? What are the weather conditions for the coming month?
You can apply the forecast model wherever the historical numeric data is applicable. For example, a manufacturing company can predict how many products they can produce per hour. At the same time, an insurance company can expect how many people are interested in their monthly policy.
Unlike the classification and forecast model, which works on the historical data, the outliers model of predictive analytics considers the anomalous data entries from the given dataset for predicting future outcomes.
The model can analyze the unusual data either by itself or by combining it with other categories and numbers present. Because the outliers model is widely helpful in industries and domains such as finance and retail, it helps to save thousands and millions of dollars for the organizations.
As the predictive outliner model can analyze the anomalies so effectively, it is highly used to detect fraud and cyber crimes easily and quickly before it occurs. For example, it helps to find unusual behavior during bank transactions, insurance claims, or spam calls in the support systems.
The time series model of predictive analytics is the best choice when considering time as the input parameter to predict future outcomes. This predictive model works with data points drawn from the historical data to develop the numerical metric and predict future trends.
If the business wishes to foresee future changes in their organization or products over a specific time, the time series predictive model is their solution. This model involves the conventional method of finding the process and dependency of various business variables. Also, it considers the extraneous factors and risks that can affect the business at a large scale with passing time.
Talking about the use cases, this predictive analytics model helps identify the expected number of calls for any customer care center for next week. It can also analyze the number of patients admitted to the hospital within the next week.
As you know, growth is not necessary to be linear or static. Therefore, the time series model helps get better exponential growth and alignment for the company’s trend.
The use of predictive analytics is to predict future outcomes based on past data. The predictive algorithm can be used in many ways to help companies gain a competitive advantage or create better products, such as medicine, finance, marketing, and military operations.
However, you can separate the predictive analytics algorithms into two categories:
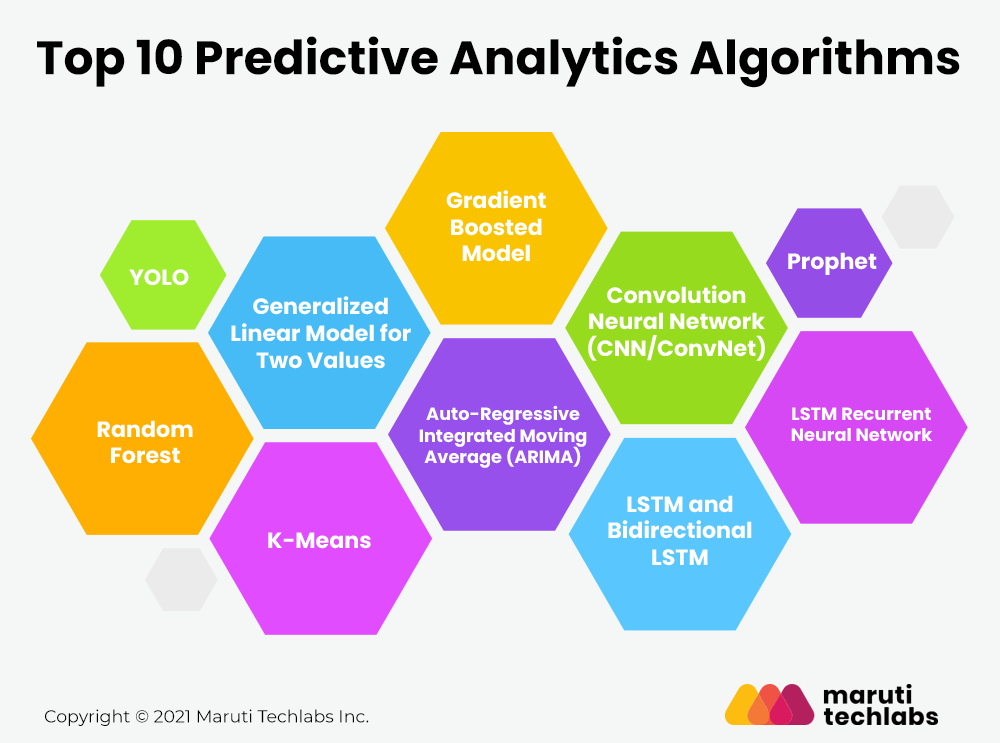
You can apply numerous predictive algorithms to analyze future outcomes using the predictive analytics technique and machine learning tools. Let us discuss some of those powerful algorithms which predictive analytics models most commonly use:
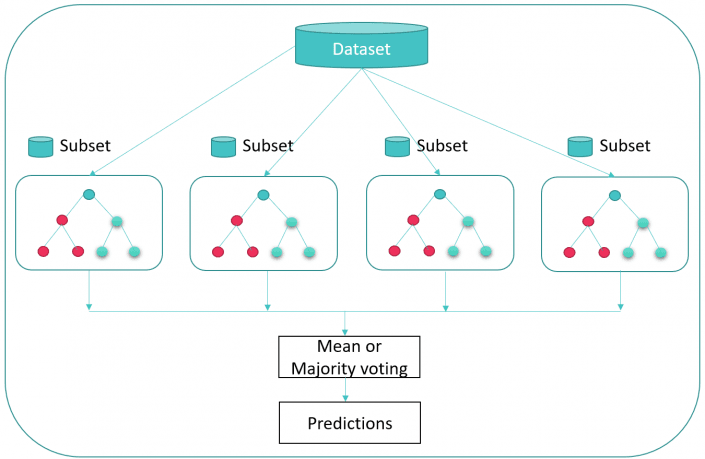
Random forest algorithm is primarily used to address classification and regression problems. Here, the name “Random Forest” is derived as the algorithm is built upon the foundation of a cluster of decision trees. Every tree relies on the random vector’s value, independently sampled with the same distribution for all the other trees in the “forest.”
These predictive analytics algorithms aim to achieve the lowest error possible by randomly creating the subsets of samples from given data using replacements (bagging) or adjusting the weights based on the previous classification results (boosting). When it comes to random forest algorithms, it chooses to use the bagging predictive analytics technique.
When possessed with a lot of sample data, you can divide them into small subsets and train on them rather than using all of the sample data to train. Training on the smaller datasets can be done in parallel to save time.
Some of the common advantages offered by the random forest model are:
The generalized linear model is a complex extension of the general linear model. It takes the latter model’s comparison of the effects of multiple variables on continuous variables. After that, it draws from various distributions to find the “best fit” model.
The most important advantage of this predictive model is that it trains very quickly. Also, it helps to deal with the categorical predictors as it is pretty simple to interpret. A generalized linear model helps understand how the predictors will affect future outcomes and resist overfitting. However, the disadvantage of this predictive model is that it requires large datasets as input. It is also highly susceptible to outliers compared to other models.
To understand this prediction model with the case study, let us consider that you wish to identify the number of patients getting admitted in the ICU in certain hospitals. A regular linear regression model would reveal three new patients admitted to the hospital ICU for each passing day. Therefore, it seems logical that another 21 patients would be admitted after a passing week. But it looks less logical that we’ll notice the number increase of patients in a similar fashion if we consider the whole month’s analysis.
Therefore, the generalized linear model will suggest the list of variables that indicate that the number of patients will increase in certain environmental conditions and decrease with the passing day after being stabilized.
The gradient boosted model of predictive analytics involves an ensemble of decision trees, just like in the case of the random forest model, before generalizing them. This classification model uses the “boosted” technique of predictive machine learning algorithms, unlike the random forest model using the “bagging” technique.
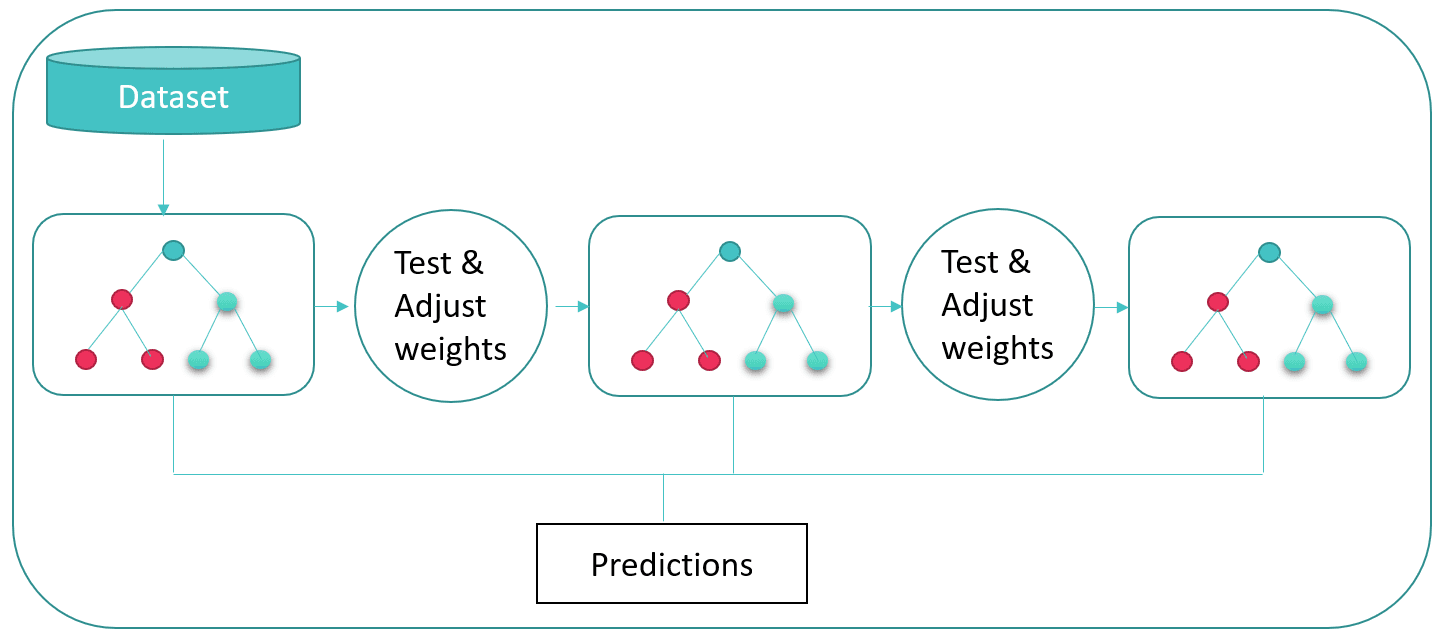
The gradient boosted model is widely used to test the overall thoroughness of the data as the data is more expressive and shows better-benchmarked results. However, it takes a longer time to analyze the output as it builds each tree upon another. But it also shows more accuracy in the outputs as it leads to better generalization.
K-means is a highly popular machine learning algorithm for placing the unlabeled data points based on similarities. This high-speed algorithm is generally used in the clustering models for predictive analytics.
The K-means algorithm always tries to identify the common characteristics of individual elements and then groups them for analysis. This process is beneficial when you have large data sets and wish to implement personalized plans.
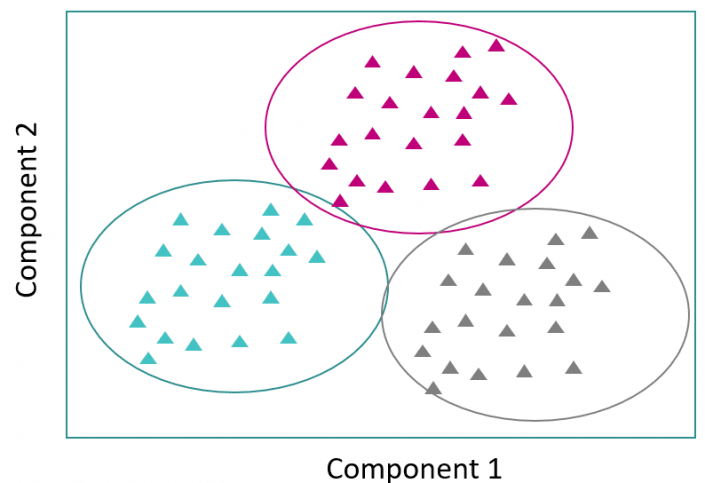
For instance, a predictive model for the healthcare sector consists of patients divided into three clusters by the predictive algorithm. One such group possessed similar characteristics – a lower exercise frequency and increased hospital visit records in a year. Categorizing such cluster characteristics helps us identify which patients face the risk of diabetes based on their similarities and can be prescribed adequate precautions to prevent diseases.
The Prophet algorithm is generally used in forecast models and time series models. This predictive analytics algorithm was initially developed by Facebook and is used internally by the company for forecasting.
The Prophet algorithm is excellent for capacity planning by automatically allocating the resources and setting appropriate sales goals. Manual forecasting of data requires hours of labor work with highly professional analysts to draw out accurate outputs. With inconsistent performance levels and inflexibility of other forecasting algorithms, the prophet algorithm is a valuable alternative.
The prophet algorithm is flexible enough to involve heuristic and valuable assumptions. Speed, robustness, reliability are some of the advantages of the prophet predictive algorithm, which make it the best choice to deal with messy data for the time series and forecasting analytics models.
The ARIMA model is used for time series predictive analytics to analyze future outcomes using the data points on a time scale. ARIMA predictive model, also known as the Box-Jenkins method, is widely used when the use cases show high fluctuations and non-stationarity in the data. It is also used when the metric is recorded over regular intervals and from seconds to daily, weekly or monthly periods.
The autoregressive in the ARIMA model suggests the involvement of variables of interest depending on their initial value. Note that the regression error is the linear combination of errors whose values coexist at various times in the past. At the same time, integration in ARIMA predictive analytics model suggests replacing the data values with differences between their value and previous values.
There are two essential methods of ARIMA prediction algorithms:
Long short term memory or LSTM recurrent neural network is the extension to Artificial Neural Networks. In LSTM RNN, the data signals travel forward and backward, with the networks having feedback connections.
Like many other deep learning algorithms, RNN is relatively old, initially created during the 1980s; however, its true potential has been noticed in the past few years. With the increase in big data analysis and computational power available to us nowadays, the invention of LSTM has brought RNNs to the foreground.
As LSTM RNN possesses internal memory, they can easily remember important things about the inputs they receive, which further helps them predict what’s coming next. That’s why LSTM RNN is the preferable algorithm for predictive models like time-series or data like audio, video, etc.
To understand the working of the RNN model, you’ll need a deep knowledge of “normal” feed-forward neural networks and sequential data. Sequential data refers to the ordered data related to things that follow each other—for instance, DNA sequence. The most commonly used sequential data is the time series data, where the data points are listed in time order.
Convolution neural networks(CNN) is artificial neural network that performs feature detection in image data. They are based on the convolution operation, transforming the input image into a matrix where rows and columns correspond to different image planes and differentiate one object.
On the other hand, CNN is much lower compared to other classification algorithms. It can learn about the filters and characteristics of the image, unlike the primitive data analytics model trained enough with these filters.
The architecture of the CNN model is inspired by the visual cortex of the human brain. As a result, it is quite similar to the pattern of neurons connected in the human brain. Individual neurons of the model respond to stimuli only to specific regions of the visual field known as the Receptive Field.
As mentioned above, LSTM stands for the Long Short-Term Memory model. LSTM is a gated recurrent neural network model, whereas the bidirectional LSTM is its extension. LSTM is used to store the information and data points that you can utilize for predictive analytics. Some of the key vectors of LSTM as an RNN are:
The decisions of long-term state for reading, storing, and writing is dependent on the activation function, as shown in the below image. The output of this activation function is always between (0,1).
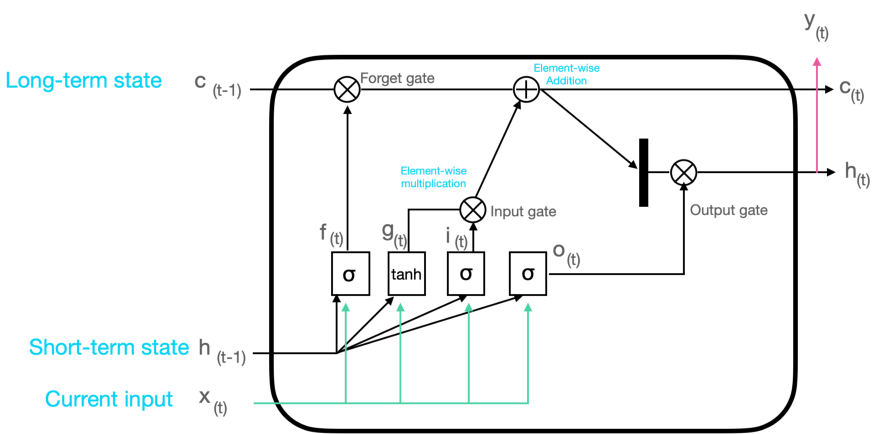
The forget gate and the output gate decide whether the passing information should be kept or get rejected. At last, the memory of the LSTM block and the condition at the output gates helps the model to make the decisions. The generated output is then again considered as the input and passed through the network for recurrent sequence.
On the other hand, bidirectional LSTM uses two models, unlike the LSTM model training the single model at a time. The first model learns the sequence of the input followed by the second, which learns the reverse of that sequence.
Using the bidirectional LSTM model, we have to build the mechanism to combine both the models, and these methods of combining are called the merge step. Merging of the models can be done by one of the following functions:
YOLO is an abbreviation for the “You Only Look Once” algorithm, which uses the neural network to enable real-time object detection. This predictive analytics algorithm helps to analyze and identify various objects in the given picture in real-time.
The YOLO algorithm is quite famous for its accuracy and speed for getting the outputs. The object detection in the YOLO algorithm is done using a regression problem which helps to provide the class probabilities of detected images. The YOLO algorithm also employs the concepts of convolution neural networks to see images in real-time.
As the name suggests, the YOLO predictive algorithm uses single forward propagation through the neural network model to detect the objects in the image. It means that the YOLO algorithm makes predictions in the image by a single algorithm run, unlike the CNN algorithm, which simultaneously uses multiple probabilities and bounding boxes.
Every predictive analytics model has its strengths and weaknesses, and therefore, every one of them is best used for any specific use cases. However, all these predictive models are best adjusted for standard business rules as they all are pretty flexible and reusable. But the question is, how do these predictive models work?
All predictive analytics models are reusable and trained using predictive algorithms. These models run one or more algorithms on the given data for predicting future outcomes. Note that it is a repetitive process because it involves training the models again and again. Sometimes, more than one model is used on the same dataset until the expected business objective is found.
Apart from its repetitive nature, the predictive analytics model also works as an iterative process. It begins to process the data and understand the business objective, later followed by data preparation. Once the preparation is finished, data is then modeled, evaluated, and deployed.
Additional Read: 13 Mistakes to Avoid in Implementing Predictive Analytics
The predictive algorithms are widely used during these processes as it helps to determine the patterns and trends in the given data using data mining and statistical techniques. Numerous types of predictive analytics models are designed depending on these algorithms to perform desired functions. For instance, these algorithms include regression algorithm, clustering algorithm, decision tree algorithm, outliers algorithm, and neural networks algorithm.
With the immense advancement in machine learning and artificial intelligence, it has become relatively easy to analyze faces and objects in photos and videos, transcribe the audio in real-time, and predict the future outcomes of the business and medical field in advance and take precautions. But to have the desired output for all these tasks, various predictive analytics techniques are used in predictive models using the knowledge gained from history. Let us understand a couple of such predictive analytics techniques in brief:
Transfer Learning is the predictive modeling technique that can be used partly or fully on different yet similar problems and improve the model’s performance for the given situation.
Transfer learning technique is quite popular in the domain like deep learning because it can train the neural networks of the deep learning model using a tiny amount of data in less time than other methods. Most of the real-world problems do not have labeled data, and therefore, finding its use in a field like data science is pretty complex.
Transfer learning is widely used when you have very little data to train the entire model from scratch. It is the optimized method that allows the rapidly improved performance in the models. Transfer learning is also helpful for the problems with multitask learning and concept drift which are not exclusively covered in deep learning.
As weights in one or more layers are reused from a pre-trained network model to a new model, the transfer learning technique helps to accelerate the training of neural networks by weight initializing scheme or feature extraction method.
To apply the transfer learning technique, you have to select the predictive modeling problem with a large amount of data and the relation between the input, output data, or mapping from the input data to output data. Later, a naive model is to be developed so that feature learning can be performed.
The model fit on the source task can then be used as the initial point for the second task model of interest. Depending on the predictive modeling technique, it may involve using all the parts of the developing model. Also, it may need to refine the input-output data that is available for the task of interest.
Suppose we have many images displaying a particular transportation method and its corresponding type, but we do not have enough vehicle data to detect the transportation method using predictive analytics. Using the transfer learning technique, we can use the knowledge of the first task to learn the new behavior of the second task more efficiently. That means detecting the method of transport is somehow similar to detecting the vehicles, and therefore, with little vehicle data, we can quickly train our network model from scratch.
Ensembling or Ensemble Technique combines multiple models instead of the single model, significantly increasing the model’s accuracy. Due to this advantage of ensemble methods, it is widely used in the domain like machine learning.
The ensemble method is further categorized into three different methods:
Bootstrap Aggregation, commonly known as bagging, is mainly used in classification and regression models of predictive analytics. Bagging helps increase the model’s accuracy using the decision trees and reduces the output variance to a large extent. The final output is obtained using multiple models for accuracy by taking an average of all the predictive models’ output.
Boosting is the ensemble technique that trains from the previous prediction mistakes and makes better predictions in the future. These predictive analytics techniques help improve the model’s predictability by combining numerous weak base learners to form strong base learners. Boosting strategy arranges the weak learners to get trained from the next learner in the sequence to create a better predictive model.
In boosting the predictive analytics technique, subsetting is achieved by assigning the weights to each of the models, and later, these weights are updated after training the new models. At last, the weighted averaging combines all the model results and finds the final output of all trained models.
Stacked generalization, often referred to as stacking, is another ensembling technique that allows training the algorithm for ensembling various other similar predictive analytics algorithms. It has been successfully implemented in regression, distance learning, classification, and density estimation. Stacking can also be used to measure the error rate involved during the bagging technique.
Ensembling methods are pretty popular for reducing the variance in the model and increasing the accuracy of the predictions. The best way to minimize the variance is by using multiple predictive analytics models and forming a single prediction chosen from all other possible predictions from the combined model. Based on considerations of all predictions, ensemble models combine various predictive models to ensure that predictive analytics results are at their best.
Developing a predictive analytics model is not an easy task. Below are the five steps by which you can quickly build the predictive algorithm model with minimum effort.
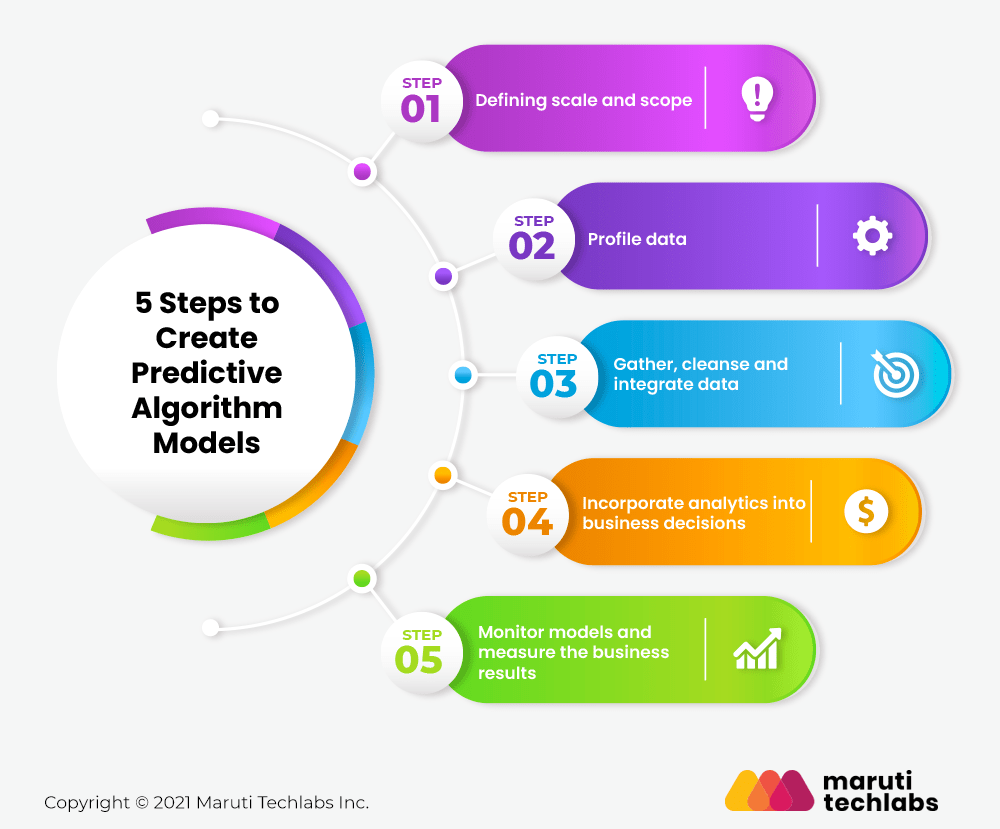
Identify the process which will be used in the predictive analytics model and define the expected business outcome.
The second step is to explore the data needed for predictive analytics. As predictive analytics is data-intensive, organizations have to decide where they should collect the data and how they can access it.
After collecting and storing the data, it is necessary to integrate and clean it. This step is essential because the predictive analytics model depends on a solid work foundation to predict accurate results.
The predictive model is now ready to use and integrate its output into the business process and decisions to get the best outcomes.
The predictive model needs to be analyzed to identify the genuine contributions to the business decisions and further outcomes.
Predictive analytics models use various statistical, machine learning, and data mining techniques to predict future outcomes. You can select any algorithm after identifying your model objectives and data on which your model will work.
Many of these predictive analytics algorithms are specially designed to solve specific problems and provide new capabilities which make them more appropriate for your business. You can choose from numerous algorithms available to address your business problems, such as:
Some predictive analytics outcomes are best obtained by building the ensemble model, i.e., a model group that works on the same data. The predictive models can take various forms, such as a query, a decision tree, or a collection of scenarios. Also, many of them work best for specific data and use cases. For example, you can use the classification algorithm to develop the decision tree and predict the outcome of a given scenario or find the answer to the given questions:
Also, you can use the unsupervised clustering algorithm to identify the relationships between the given dataset. These predictive analytics algorithms help find different groupings among the customers and identify the services that can be further grouped.
Apart from the numerous benefits of the predictive analytics model, you cannot define it as the fail-safe, fool-proof model. The predictive analytics model has certain limitations specified in the working condition to get the desired output. Some of the common limitations also mentioned in the McKinsey report are:
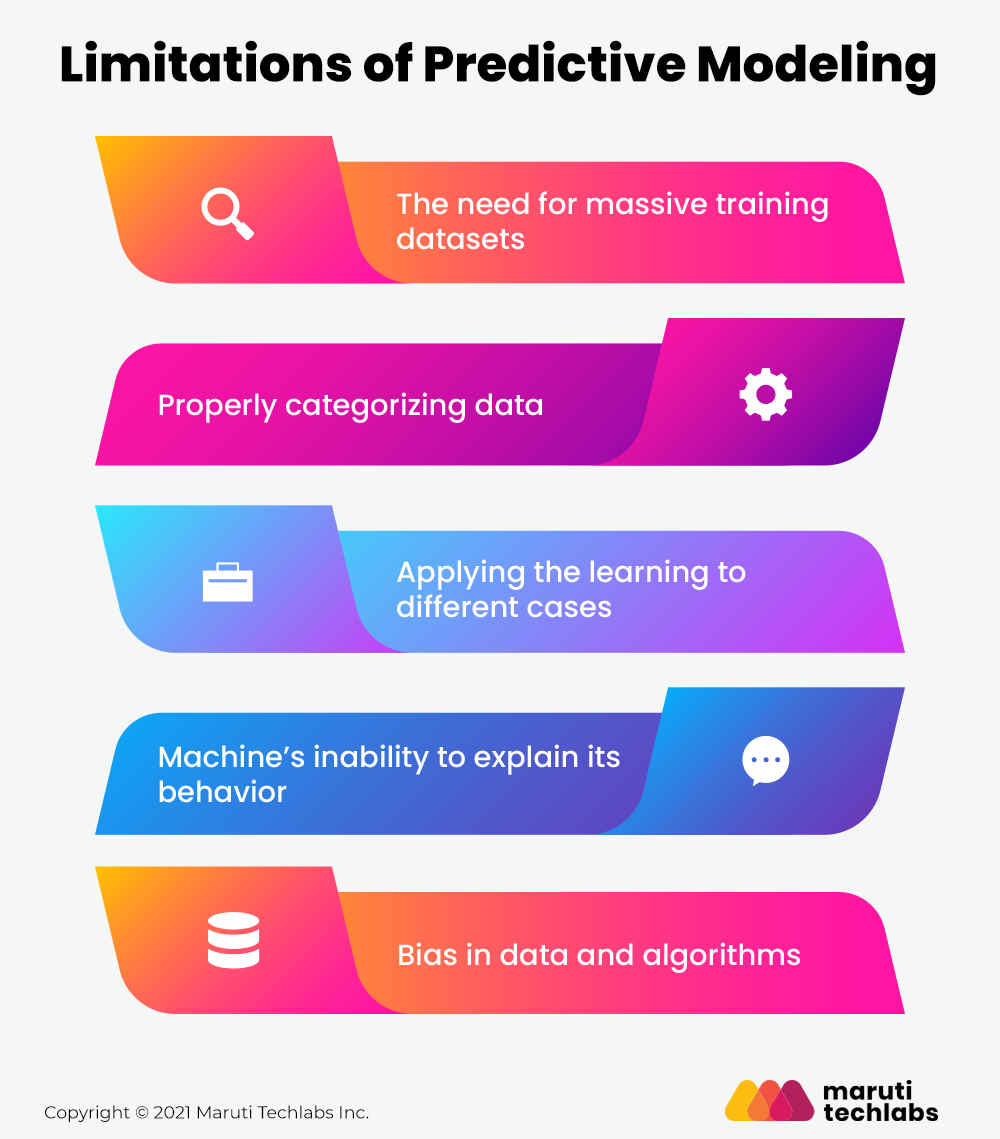
It is necessary to have many sample datasets to predict the success and desired output by the predictive analytics model. Ideally, the sample size of the dataset should be in the range of high thousands to a few million.
If the dataset size is smaller than the predictive analytics model, the output will be full of anomalies and distorted findings. Due to this limitation, many small and medium-sized organizations fail to work with predictive models as they do not have much data to work with.
You can fix this limitation by using “one-shot learning,” The machine gets training from a small amount of data demonstration instead of massive datasets.
The predictive analytics model depends on the machine learning algorithm, which only assesses the appropriately labeled data. Data labeling is a quite necessary and meticulous process as it requires accuracy. Incorrect labeling and classification can cause massive problems like poor performance and delay in the outputs.
You can overcome this problem using reinforcement learning or generative adversarial networks(GANs).
Data models generally face a huge problem in transferring the data findings from one case to another. As predictive analytics models are effective in their conclusions, they struggle to transfer their outputs to different situations.
Hence, there are some applicable issues when you wish to derive the finding from predictive models. In other words, they face trouble in applying what they have learned in new circumstances. To solve this problem, you can make use of specific methods like the transfer learning model.
As we know, machines do not “think” or “learn” like human beings. Therefore, their computations are pretty complex for humans to understand. It makes it difficult for the machine to explain its logic and work to humans. Eventually, transparency is necessary for many reasons where human safety ranks the top. To solve this issue, you can utilize local-interpretable-model-agnostic explanations(LIME) and attention techniques.
Non-categorization of the data can lead to skewed outcomes and mislead a large group of humans. Moreover, baked-in biases are quite challenging to purge later. In other words, biases tend to self-perpetuate, which moves the target, and no final goal can be identified.
Because of the extensive economic value generation, predictive analytics models will play an essential role in the future. It is the best solution for providing abundant opportunities for business evolution. Using predictive analytics, businesses and organizations can take proactive actions to avoid the risks in various functions.
Even if your business already uses a predictive analytics model, there will always be a new frontier to deploy it on by presenting a wide range of value propositions. Apart from risk prevention, predictive analytics also helps your business analyze the patterns and trends to improve and increase your organization’s performance. It helps determine the next step for your enterprise to evolve and systematically learn from the organizational experience. If you consider business a “number game,” predictive analytics is the best way to play it.
When selecting an algorithm for the predictive model, data and business metrics are not the only factors to be considered. The expertise of your AI software solution partner plays a vital role in picking the suitable algorithm that will help your model with the desired output.
One of our clients for whom we have implemented predictive analytics belongs to the automotive industry. They offer a used car selling platform that empowers its users to sell and purchase vehicles.
The client had challenges mapping out sales cycles and patterns of different makes on a specific time period. It was difficult to assess and get a clear idea of sale value for different vehicles on existing statistical models used for average sale value predictions.
Detecting seasonal patterns needs rich domain expertise, and the entire process is entirely dependent on a variety of data. Automating seasonality prediction would mean dealing with a variety of datasets, running them against algorithms, and judging the efficiency of each algorithm.
Our experienced natural language processing consultants tested various models to analyze and shed some light on how the seasonal trends impact our client’s overall sales in the US used cars market. The models are as follows:
We observed that the results using ensembling ARIMA and RNN were significantly improved than those of the previous models.
Using predictive analytics to better understand seasonal patterns, the client gained significant insights that helped accelerate their sales process and shorten cycles. The client was also able to form a more cohesive sales strategy using the seasonality ASV predictions that assisted them in modifying prices and identifying untapped sales opportunities.
Whether you are a start-up or business enterprise, Maruti Techlabs as your data analytics solutions partner will empower you to make strategic decisions and put a wealth of advanced capabilities at your fingertips. With over 12 years of experience, we help businesses strengthen their AI Strategy and Readiness by delivering flexible, scalable, and insights-driven analytical solutions tailored to unique business goals.
Connect with our team to get more out of your data.
Curious to see how prepared your organization is for advanced AI and analytics adoption? Try our AI Readiness Assessment Tool to evaluate your current readiness and plan your next steps toward smarter decision-making.
The best predictive analytics algorithm for sales forecasting depends on the data and business context, but commonly used and highly effective ones include:
Predictive analytics forecasts future outcomes based on historical data, identifying trends and potential events.
In contrast, prescriptive analytics suggest specific actions or decisions to achieve desired outcomes, often using optimization and simulation techniques.
Predictive analytics models help businesses make smarter decisions by forecasting future trends, risks, and opportunities. They enable teams to identify customer churn early, predict product demand, prevent equipment failures, and allocate resources more efficiently. By providing clear, data-backed insights, predictive analytics drives faster and more confident decision-making across the organization.
The accuracy of predictive analytics models depends on factors such as data quality, algorithm selection, and regular model updates. Clean, diverse, and well-structured data typically leads to higher accuracy. Businesses also improve reliability by continuously monitoring performance and retraining models. Accuracy is measured using metrics like precision, recall, and mean absolute error to ensure predictions stay aligned with real outcomes.
Major challenges include poor data quality, missing information, selecting the right algorithms, and avoiding bias or overfitting. Many teams also struggle with model transparency and interpretability. Strong data governance, proper validation methods, and continuous monitoring help overcome these challenges and ensure predictive models perform consistently.
Predictive analytics models leverage machine learning algorithms to identify hidden patterns in large datasets and improve automatically over time. Techniques like regression, classification, and clustering help predict customer behavior, equipment issues, market trends, and more. As new data is added, machine learning enhances model accuracy, making predictions increasingly reliable.
Predictive analytics delivers value across industries. Finance uses it for fraud detection and credit scoring, manufacturing for demand planning and maintenance, healthcare for patient risk prediction, and retail for customer behavior insights and inventory optimization. Any industry that relies on data can use predictive analytics to reduce costs and make proactive, informed decisions.


