

Cluster Analysis in Predictive Analytics: A Complete Guide to Types, Methods, Algorithms, and Real-World Applications
Key Takeaways
- Cluster analysis groups data by similarity without predefined labels, unlike classification, which relies on labeled training data.
- There are 9 core clustering methods, but K-Means, DBSCAN, and Hierarchical clustering cover most real-world use cases.
- Choosing the right algorithm depends on three factors: whether your data has noise, whether you know the number of clusters in advance, and dataset size.
- Validate results using the Elbow Method and Silhouette Score together, not just one metric alone.
- Common pitfalls such as sensitivity to outliers, high-dimensional data, and choosing K all have established fixes (DBSCAN, PCA/t-SNE, and Elbow/Silhouette, respectively).
- Applications span nearly every industry, from customer segmentation and fraud detection to healthcare diagnostics and single-cell biology research.
Introduction
Spotify's research team once asked a deceptively simple question: why do some users skip a song immediately while others let it play, save it, and come back to it later? To answer it, their data scientists didn't survey users.
They used unsupervised clustering on listening data to identify four user groups based on listening behavior: background discovery, active listening, saving for later, and deep engagement. That single clustering exercise now shapes how Spotify evaluates and tunes its recommendation system.
This is called cluster analysis, which helps find structure in data that no one explicitly labeled, then uses that structure to make better decisions. And the need for it is only growing. The total volume of data created, captured, copied, and consumed worldwide is estimated at 173.4 zettabytes in 2025 and forecast to reach 527.5 zettabytes by 2029, effectively tripling in four years.
The following guide breaks down how cluster analysis works, where it fits into a machine learning-driven predictive analytics workflow, and how to apply it in practice.
What is Cluster Analysis?
Cluster analysis is an unsupervised machine learning and statistical technique that groups similar data points based on shared characteristics. Data points within the same cluster are more similar to each other than to those in other clusters. It helps uncover hidden patterns and natural groupings in unlabeled data without relying on predefined categories.
Cluster analysis enables you to sort a set of entities into natural groups. The degree of association between two entities is highest when they belong to the same cluster and lowest when they don't. You can visualize the result as a multidimensional map, where each cluster forms a distinct region of closely related points.
Cluster analysis is typically used as a preprocessing step, applied before deeper analysis to surface patterns that aren't obvious from raw data alone. It's also commonly used to reduce a dataset's dimensionality by grouping similar attributes, thereby simplifying downstream analysis and improving computational efficiency.
The output of a clustering algorithm is usually visualized in one of three ways, depending on the method used:
- Dendrograms (tree diagrams showing how clusters merge, typical of hierarchical clustering)
- Scatter plots (points plotted across two dimensions, colored by cluster, typical of K-Means and DBSCAN), or
- T-SNE plots (a dimensionality-reduction technique used to visualize high-dimensional clusters in 2D or 3D).
Each makes it easy to spot which elements form tight groups and which stand out as outliers.
What Are the Types of Cluster Analysis? 9 Clustering Methods Explained
Clustering algorithms fall into five broad families: partitioning, density-based, hierarchical, distribution-based, and grid-based.
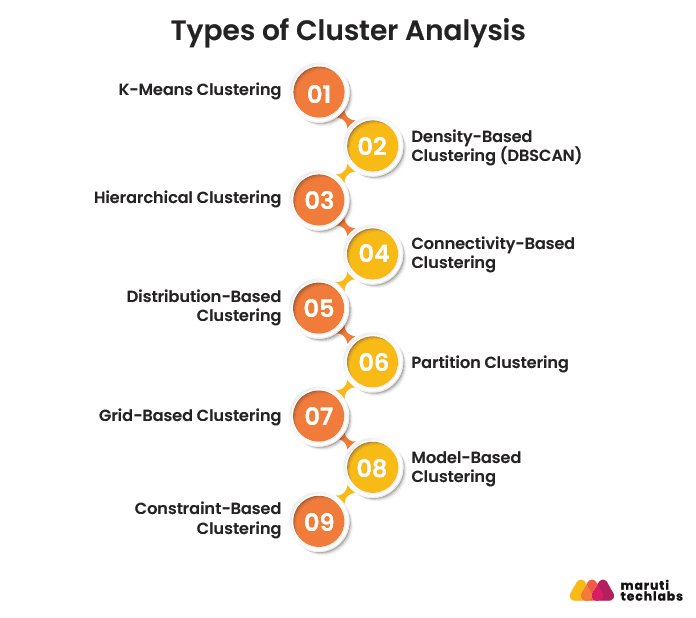
The nine methods below cover all five, starting with the three most widely used in production.
K-Means Clustering
K-Means is the most widely used clustering algorithm, valued for its simplicity and speed on large datasets. It divides data into a predefined number of clusters (K). The algorithm starts by placing cluster centers (centroids) randomly, assigns each data point to the nearest centroid, recalculates the centroids based on the assigned points, and repeats the process until the centroids no longer change significantly.
Since K must be chosen in advance, most practitioners use the Elbow Method to find it, running K-Means across a range of K values and plotting the within-cluster sum of squares (WCSS). The point where improvement sharply slows, the "elbow," marks a reasonable starting value for K. K-Means assumes spherical, similarly sized clusters, making it fast on well-separated data but a poor fit for irregular shapes or heavy outliers.
Density-Based Clustering (DBSCAN)
DBSCAN (Density-Based Spatial Clustering of Applications with Noise) groups points by density rather than distance from a centroid, defining a cluster as a region where points are packed closely together. It uses two parameters: epsilon (ε), the maximum distance between neighboring points, and minPts, the minimum neighbors needed to form a dense region.
Points meeting minPts become core points; points near a core point but without enough neighbors become border points; everything else is labeled noise.
Unlike K-Means, DBSCAN doesn't require specifying the number of clusters upfront and can detect arbitrarily shaped clusters. It also handles outliers natively, making it well suited to anomaly and fraud detection.
Hierarchical Clustering
Hierarchical clustering builds a tree of nested clusters instead of a single flat partition, without requiring the number of clusters in advance. It comes in two forms: agglomerative (bottom-up), where every point starts as its own cluster and pairs are progressively merged, and divisive (top-down), where one cluster is progressively split. Agglomerative is more commonly used.
The result is a dendrogram (tree diagram) that shows how clusters merge. You can cut the tree at different levels to choose the number of clusters. Ward linkage is the most common merging rule, combining the pair of clusters that produces the smallest increase in within-cluster variance, typically yielding compact, evenly sized clusters.
Connectivity-Based Clustering
Connectivity-based clustering works on the principle that data points closer together in the data space are more similar than points farther apart, using distance to build clusters that grow or shrink as the distance threshold changes. Hierarchical clustering is the most common real-world implementation of this model.
Proximity-based variants are easy to interpret since the logic mirrors intuitive notions of “closeness,” but they scale poorly on large datasets because they require computing distances between every pair of points.
Distribution-Based Clustering
Distribution-based clustering assumes that data points belonging to the same cluster were generated by the same underlying probability distribution, typically Gaussian. Gaussian Mixture Models (GMM) are the most common implementation: instead of assigning each point to exactly one cluster, GMM assigns a probability of belonging to each cluster, allowing clusters to overlap.
This makes the approach well suited to elliptical or overlapping cluster shapes that K-Means would force into spherical groupings, though its accuracy depends heavily on how closely the real data matches the assumed distribution.
Partition Clustering
Partitioning clustering divides a dataset of n objects into k partitions, where k is less than or equal to n. Each object belongs to exactly one partition, and each partition contains at least one object. K-Means is the best-known partitioning algorithm.
K-Medoids is a variation of K-Means that uses actual data points as cluster centers instead of averages. This makes it more resistant to outliers and easier to interpret.
Grid-Based Clustering
Grid-based clustering quantizes the data space into a finite number of cells, forming a grid, and then clusters based on cell density rather than evaluating individual data points against one another. Because processing time depends on the number of grid cells rather than the number of data points, this approach scales well on very large datasets.
STING and CLIQUE are the most cited grid-based algorithms, though the method sees less production use than partition- or density-based approaches.
Model-Based Clustering
Model-based clustering assumes the data were generated by an underlying statistical model and then searches for the model parameters that best explain the observed data, rather than clustering based on raw distances or densities.
This lets the algorithm estimate the number of clusters directly from the data and statistically account for noise, instead of requiring K to be fixed up front. It overlaps conceptually with distribution-based clustering (GMM is technically both), but the broader model-based family also includes non-probabilistic statistical and Bayesian approaches to cluster fitting.
Constraint-Based Clustering
Constraint-based clustering incorporates user-defined or application-specific rules directly into the clustering process, rather than relying purely on distance or density. Constraints might specify that certain points must (or must not) end up in the same cluster, or set a minimum and maximum number of clusters allowed.
This makes it useful in business contexts like customer segmentation, where domain rules (for example, high-value and low-value customers must never be grouped together) need to override what the raw data would otherwise produce.
Key Requirements for Cluster Analysis in Data Mining
For cluster analysis to produce reliable, usable results, the underlying algorithm and dataset must meet a set of core technical requirements, chief among them is scalability. These include the ability to handle different attribute types, discovery of arbitrarily shaped clusters, robustness to noise and outliers, and insensitivity to the order in which records are processed.
1. Handle different attributes
As a single cluster analysis algorithm may be applied to multiple data sets with varying characteristics, it is advisable to use a flexible clustering algorithm that can handle multiple attribute types, such as binary, numerical, and categorical data.
2. Handle noisy data
Datasets sometimes may contain irrelevant, missing, or noisy data. Several algorithms are sensitive to such data and may produce low-quality results.
3. Identify clusters with random shapes
Clusters of any form should be detectable by the cluster analysis technique. They should not be restricted to distance measurements that locate spherical clusters of tiny sizes.
4. Scalability
When dealing with large datasets, it is necessary to have a highly scalable cluster analysis algorithm.
5. High dimensionality
Some datasets are low-dimensional, and some are high-dimensional. The cluster analysis algorithm must be able to handle both kinds of dimensionalities.
6. Interpretability
The result of the clustering algorithm must be easy to interpret and understand. Also, it is not possible to have new clustering algorithms for every data analysis. Hence, it helps to have an algorithm that is, to some extent, reusable.
7. Computational Efficiency
Clustering algorithms need to run within a practical time and resource budget as data volume grows, not just perform well on small test samples. An algorithm that works fine on 10,000 records can become impractical at 10 million if runtime scales poorly, an issue teams often don't catch until it's already slowing production.
If your infrastructure is under evaluation for large-scale clustering, invest in data engineering services to strengthen system foundations and ensure consistent performance under load.
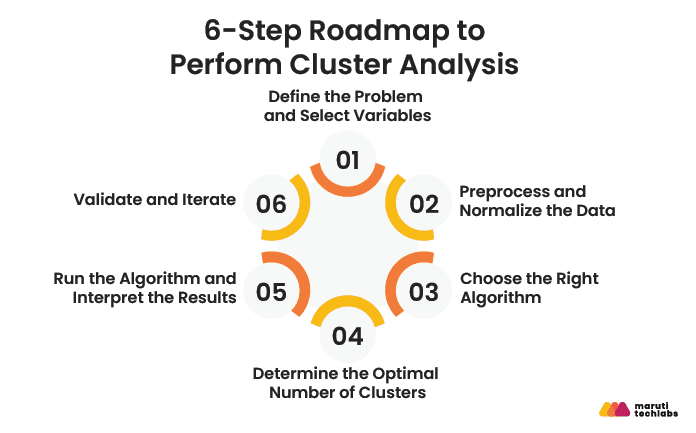
How to Perform Cluster Analysis: A 6-Step Roadmap
Running cluster analysis reliably comes down to six steps: define the problem, prepare the data, choose the right algorithm, determine the optimal number of clusters, run and interpret the model, then validate and iterate.
Step 1: Define the Problem and Select Variables
Start by clearly defining what you want to group and why. For example, instead of simply aiming to "segment customers," define a specific goal, such as grouping customers by purchase frequency and average order value to create targeted retention campaigns.
Once the objective is set, choose only the variables that support that goal. Including irrelevant variables can reduce clustering accuracy and make the results less meaningful.
Step 2: Preprocess and Normalize the Data
Clean the dataset by handling missing values and removing duplicate records. Then normalize or standardize the variables so no single feature dominates the distance calculation purely because of its scale. For instance, "annual income" (values in the thousands) will overwhelm "number of purchases" (values in single digits) unless both are scaled to a comparable range first.
Step 3: Choose the Right Algorithm
Which algorithm to use depends on three questions about your data:
Question | If yes | If no |
Does the data likely contain noise or outliers? | DBSCAN | Continue |
Do you already know how many clusters you want? | K-Means | Hierarchical Clustering |
Is the dataset very large (millions of records)? | K-Means or Grid-based | Hierarchical is fine |
Most production use cases land on K-Means for speed and simplicity, DBSCAN when outliers matter, or Hierarchical when the dataset is small enough to afford it, and you want to explore the full cluster structure before committing to a number.
Step 4: Determine the Optimal Number of Clusters
If you're using K-Means, you need to decide K before running the algorithm. The Elbow Method plots within-cluster sum of squares (WCSS) across a range of K values and looks for the point where improvement sharply levels off. The Silhouette Score offers a second check, measuring how similar each point is to its own cluster versus the next-nearest one, on a scale from -1 to 1. Scores above 0.5 generally indicate well-separated, reasonably confident clusters.
Step 5: Run the Algorithm and Interpret the Results
Run the chosen algorithm and examine the resulting clusters for the traits that matter to your original objective, not just statistical validity. A "valid" cluster that carries no business meaning isn't useful. Profile each cluster by its dominant characteristics, for example, naming a cluster "high-frequency, low-spend customers," so the output can actually inform a decision.
Step 6: Validate and Iterate
Check the results against the validation metrics covered later in this guide, and sanity-check them against domain knowledge. A data scientist's read on whether the groupings make business sense is still one of the most reliable checks available. If the clusters don't hold up, revisit the variables, preprocessing, or algorithm choice and run the process again. Clustering is rarely a one-pass exercise.
Ran this against the actual Iris dataset (UCI/scikit-learn's built-in public dataset) so the output below is real, not illustrative.
Cluster Analysis in Python: Tools and Implementation
Cluster analysis in Python is typically implemented using scikit-learn to group unlabeled data based on feature similarity. As a core unsupervised learning technique, it is used in production systems for customer segmentation, anomaly detection, and pattern discovery. This section focuses on how clustering is actually executed in Python, including a working K-Means implementation, expected outputs, and tool considerations when Python is not the primary engineering stack.
Cluster Analysis with Scikit-Learn
python
import numpy as np
import pandas as pd
from sklearn. datasets import load_iris
from sklearn.preprocessing import StandardScaler
from sklearn.cluster import KMeans
from sklearn.metrics import silhouette_score
import matplotlib.pyplot as plt
# Load data
iris = load_iris()
X = iris.data
# Normalize features so no single variable dominates distance calculations
scaler = StandardScaler()
X_scaled = scaler.fit_transform(X)
# Fit K-Means with 3 clusters
kmeans = KMeans(n_clusters=3, random_state=42, n_init=10)
labels = kmeans.fit_predict(X_scaled)
# Evaluate cluster quality
score = silhouette_score(X_scaled, labels)
print(f"Silhouette Score: {score:.3f}")
# Visualize (first two features)
plt.scatter(X_scaled[:, 0], X_scaled[:, 1], c=labels, cmap='viridis')
plt.scatter(kmeans.cluster_centers_[:, 0], kmeans.cluster_centers_[:, 1],
          c='red', marker='X', s=200, label='Centroids')
plt.xlabel('Sepal Length (scaled)')
plt.ylabel('Sepal Width (scaled)')
plt.legend()
plt.title('K-Means Clustering')
plt.show()
Real-Life Example Using a Public Dataset
The snippet above was run on the Iris dataset, a public dataset of 150 flower samples across 3 species, commonly used to benchmark clustering algorithms because the true groupings are known, which makes it possible to check how well the algorithm recovers real structure.¹ Here's what running it actually returns:
Cluster sizes: [53, 50, 47]
Inertia: 139.82
Silhouette Score: 0.46
A silhouette score of 0.46 indicates moderately well-separated clusters, not perfect, but far better than random. Cross-checking the clusters against the true species labels shows why: Cluster 1 captured all 50 setosa samples with zero errors, while Clusters 0 and 2 split versicolor and virginica, which are known to overlap biologically, with some samples landing in the "wrong" cluster:
| Cluster | Setosa | Versicolor | Virginica |
0 | 0 | 39 | 14 |
1 | 50 | 0 | 0 |
2 | 0 | 11 | 36 |
This is a realistic outcome and it illustrates a point worth remembering in production: K-Means will always produce exactly K clusters, but how cleanly those clusters map to real-world categories depends on how naturally separated the underlying data actually is.
Top Cluster Analysis Tools and Libraries
Tool | Language/Platform | Best For | Notes |
| Scikit-learn | Python | General-purpose clustering, prototyping | Most widely used; consistent API across K-Means, DBSCAN, Hierarchical, GMM |
| Weka | Java (GUI + API) | No-code/low-code exploration | Good for analysts who want a visual interface over writing code |
| R (cluster package) | R | Statistical analysis, academic research | Strong for hierarchical clustering and dendrogram visualization |
| MATLAB | MATLAB | Engineering and scientific computing | Common in research and signal-processing contexts |
| Spark MLlib | Scala/Python/Java (distributed) | Large-scale clustering on distributed data | Built for datasets too large to fit in memory on a single machine |
For most production teams, Scikit-learn covers the full wokflow end to end unless the dataset requires distributed processing, at which point Spark MLlib is the standard move.
Clustering Text and LLM Embeddings
Embeddings are numerical vector representations of text that capture meaning, so that texts with similar meaning end up close together in vector space, even if they don't share any of the same words.
This solves a real limitation of traditional clustering on text: keyword- or frequency-based methods (like TF-IDF) group documents by literal word overlap, so "car won't start" and "vehicle failed to turn on" get treated as unrelated, despite meaning the same thing. Embeddings capture that semantic similarity instead.
In practice, this means running K-Means or DBSCAN not on raw text or word counts, but on embedding vectors generated by a model like Sentence-BERT or MiniLM, which convert each piece of text into a fixed-length vector before clustering runs as usual.
python
from sentence_transformers import SentenceTransformer
from sklearn.cluster import KMeans
model = SentenceTransformer('all-MiniLM-L6-v2')
texts = ["car won't start", "vehicle failed to turn on", "refund my order"]
embeddings = model.encode(texts)
kmeans = KMeans(n_clusters=2, random_state=42, n_init=10)
labels = kmeans.fit_predict(embeddings)
Reach for this over traditional feature-based clustering whenever you're working with unstructured text, support tickets, reviews, chat logs, open-ended survey responses, where meaning matters more than exact wording, and manually engineering features isn't practical.
Business Applications of Cluster Analysis (with Industry Examples)
Every industry generates data, and wherever there's data, there's an opportunity to find structure inside it. Cluster analysis has become one of the most widely applied techniques in predictive analytics precisely because that structure translates directly into business decisions. Here are ten of the most common applications across industries.
1. Marketing Segmentation
Cluster analysis lets marketers divide their audience into distinct segments based on shared behaviors and interests, rather than treating all customers as a single homogeneous group.
MetLife is a documented example: As part of a brand refresh, MetLife surveyed over 50,000 customers and used clustering to segment them by mindsets and attitudes instead of demographics, helping shape its biggest brand transformation in over 30 years. This let MetLife allocate marketing resources against the "right" customer segments instead of applying one blanket strategy across its entire base.
2. Anomaly Detection
Cluster analysis is one of the most effective ways to catch fraudulent activity in data mining. The method works by first establishing what "normal" transaction clusters look like from historical data, then flagging any new transaction that falls outside those established patterns. Mastercard's Decision Intelligence Pro platform applies this kind of pattern-based anomaly detection at scale, and Mastercard has reported that the underlying AI enhancements boost fraud detection rates by an average of 20%, and as high as 300% in some instances.
3. Biology
Biology remains one of the most active applications of cluster analysis today. The technique traces back to a landmark 1998 study that used hierarchical clustering to group genes by expression pattern,¹ and it has since evolved into a cornerstone of single-cell RNA sequencing (scRNA-seq), where clustering algorithms group individual cells by transcriptional similarity to discover new cell types and subpopulations within tissue.
Cluster analysis is a cornerstone of modern single-cell RNA sequencing (scRNA-seq), where clustering algorithms group individual cells by transcriptional similarity to discover new cell types and subpopulations within tissue.
A 2026 review found that clustering methods such as K-Means, Gaussian Mixture Models, hierarchical clustering, and deep learning approaches are still the standard for identifying cell types. This makes clustering one of the most important and fast-evolving applications in biological research.
4. Identifying New Opportunities
Clustering similar competitors, products, or markets together helps businesses spot where they stand relative to comparable offerings, and where gaps exist. Beyond direct competitive mapping, the same clustering techniques used here support broader market research, pattern recognition, and image processing tasks that feed into strategic decisions.
By clustering their current position against competitors, organizations can identify underserved segments or adjacent markets worth pursuing, rather than relying on guesswork or anecdotal market reads.
5. Data Reduction
Data reduction is an undirected use of cluster analysis. Rather than testing a specific hypothesis, it’s used to surface hidden patterns in large, unlabeled datasets. Choosing the right clustering method for this depends entirely on the shape and structure of the underlying data, since different algorithms will surface different patterns from the same dataset.
This makes cluster analysis a common early step in a broader analytics pipeline, simplifying a large dataset into meaningful groups before deeper analysis begins downstream.
6. Recommendations
Recommendation engines are one of the most visible applications of cluster analysis. Netflix has identified over 2,000 "taste communities," clusters of subscribers who share the same content preferences, which it uses to power personalized recommendations rather than showing every user the same catalog. This same clustering logic underlies most modern recommendation engines, regardless of industry.
7. Social Network Analysis
Social platforms use clustering to group users with similar interests, backgrounds, or behavior patterns. Facebook and Instagram apply this to show users content and feeds aligned with people who share similar engagement patterns, rather than a generic, one-size-fits-all feed.
This same clustering approach extends beyond feed personalization to friend/connection suggestions and ad targeting, both built on the same underlying principle of grouping similar users.
8. Operational Efficiency in Data Pipelines
Cluster analysis helps break large, complex datasets into smaller, more manageable parts, making downstream operations faster and more efficient to run. For example, running logistic regression separately on smaller clusters that follow different underlying distributions typically produces better results than forcing one model to fit the entire dataset at once.
This same principle applies to broader data pipeline design, where segmenting data before processing reduces computational load and improves model accuracy across each subset.
9. Patient Segmentation and Drug Discovery
Cluster analysis groups patients by shared clinical characteristics, symptoms, biomarkers, and treatment response, revealing disease subtypes that a single diagnostic label would otherwise treat as a uniform group. Patients in the same cluster tend to respond similarly to a given therapy, helping clinicians move beyond one-size-fits-all treatment protocols.
In drug discovery, clustering is used earlier in the pipeline to group compounds by molecular structure and biological activity, helping researchers narrow the search space before expensive trials begin.
10. Credit Risk and Fraud Detection
Financial institutions use clustering to group customers by transaction behavior and spending patterns, surfacing risk segments a single credit score can't capture. Two customers with identical scores but very different spending clusters may warrant different lending decisions.
Clustering also supports fraud detection. Transactions that fall far outside any established behavioral cluster, an approach DBSCAN (covered earlier in this guide) handles particularly well, get flagged as anomalies for review, catching patterns that fixed, rule-based thresholds tend to miss.
Limitations and Challenges of Cluster Analysis (and How to Solve Them)
Cluster analysis is powerful, but it isn't foolproof. Knowing where it tends to break down, and how to correct for it, is what separates a clustering exercise that holds up in production from one that just looks clean in a notebook.
1. Sensitivity to Initial Conditions (K-Means)
K-Means starts by placing centroids randomly, which means two runs on the same dataset can produce different clusters depending on where those centroids happen to land. A poor initial placement can cause the algorithm to converge on a suboptimal solution.
How to Mitigate this?
Use K-Means++, an improved initialization method that spreads out the starting centroids based on distance from existing ones, rather than placing them randomly. This is the default initialization in most modern implementations, including Scikit-learn, and significantly reduces the odds of poor convergence.
2. Difficulty Choosing K
K-Means requires the number of clusters to be specified in advance, but the "right" number is rarely obvious from the data alone.
How to Mitigate this?
Use the Elbow Method and Silhouette Score together (both covered earlier in this guide) rather than relying on either alone. The Elbow Method narrows down a reasonable range, and the Silhouette Score helps confirm which value in that range actually produces well-separated clusters.
3. Poor Performance on High-Dimensional Data
As the number of features grows, distance-based algorithms like K-Means start to struggle. This is the "curse of dimensionality": in high-dimensional space, the distance between any two points tends to become similarly large, making it harder for the algorithm to distinguish meaningful clusters from noise.
How to Mitigate this?
Apply dimensionality reduction before clustering. PCA (Principal Component Analysis) reduces the number of features while preserving as much variance as possible, and t-SNE is useful for visualizing high-dimensional clusters in 2D or 3D to sanity-check the results.
4. Sensitivity to Outliers
K-Means forces every point into a cluster, including outliers, which can pull centroids away from where the "real" cluster center should be and distort the results.
How to Mitigate this?
Use DBSCAN instead of K-Means when outliers are a known concern. As covered earlier in this guide, DBSCAN labels points that don't fit any dense region as noise rather than forcing them into the nearest cluster, which keeps outliers from skewing the result.
5. Algorithm Selection Ambiguity
"Clustering" isn't one method; it's a broad category covering many different techniques, each based on different criteria for what makes points similar. This means different clustering methods can be run on the exact same dataset and produce meaningfully different groupings, and it's not always obvious in advance which one is actually right for the problem at hand.
How to Mitigate this?
Use a structured decision framework rather than defaulting to the most familiar algorithm. The decision framework covered in the "How to Perform Cluster Analysis" section of this guide walks through the key questions (noise level, whether K is known, dataset size) that should drive this choice.
6. Lack of Ground Truth
Unlike classification, clustering has no labeled "correct answer" to check results against, which has historically left teams with very few reliable ways to validate whether a clustering result is actually meaningful or just internally consistent.
How to Mitigate this?
Combine internal validation metrics (like Silhouette Score, which measures cluster cohesion and separation using only the data itself) with external validation where possible (comparing results against any available labels, domain expert review, or business outcome data) rather than relying on one type of metric alone.
Conclusion
Cluster analysis turns unlabeled, messy data into groups you can actually act on, whether that's segmenting customers, catching fraud, or building the first stage of a larger predictive analytics pipeline. The right algorithm depends entirely on your data: K-Means for speed and simplicity, DBSCAN when outliers matter, Hierarchical when you want to explore structure before committing to a number of clusters.
Start small, validate your results, and let the data guide which method earns its place in production.
How Maruti Techlabs applied predictive analytics to build an ML-based sales forecasting model for a US auto parts retailer
We partnered with a US auto parts retailer who has a buyer network spread across the United States. Their existing statistical model, manual linear regression, couldn't capture the non-linearity and time-series patterns in vehicle buying behavior across different makes and models, leading to inaccurate monthly sales predictions.
Our data scientists tested multiple machine learning models against the client's datasets, evaluated each for accuracy, and transitioned the client from linear regression to a Long Short-Term Memory (LSTM) model built specifically for high prediction accuracy on this kind of sequential, seasonal data.
The impact:
- Narrowed prediction errors for high-selling parts to ±20%
- Significantly improved inventory tracking and restocking processes
- Streamlined storage allocation and operational efficiency
- Enabled scalable growth through advanced, data-driven forecasting
- Improved demand fulfillment and profitability through more reliable predictions
Beyond execution, our machine learning services cover the full lifecycle, from data engineering and model selection to deployment and ongoing optimization, so predictive models keep performing accurately as your data and business conditions evolve.

FAQs
1) What are the main requirements for performing cluster analysis?
The key requirements include well-prepared data, appropriate distance metrics, a clear definition of clustering objectives, selection of the right algorithm, and performance evaluation metrics.
2) Why is data preprocessing important before cluster analysis?
Data preprocessing — such as cleaning, normalization, and handling missing values — ensures accuracy and consistency in clustering results by removing noise and bias from raw data.
3) What types of clustering methods are used in data mining?
Common clustering methods include partitioning (like K-Means), hierarchical, density-based (DBSCAN), grid-based, and model-based clustering techniques.
4) How do I choose the right clustering algorithm for my data
Choosing the right algorithm depends on your data type, dataset size, desired number of clusters, and whether your data has noise or outliers.
5) What are the key evaluation metrics for cluster analysis?
Metrics such as Silhouette Score, Davies–Bouldin Index, Dunn Index, and Rand Index are commonly used to assess clustering performance and validity.
6) Where is cluster analysis applied in real-world scenarios?
It’s widely used in market segmentation, image recognition, customer behavior analysis, anomaly detection, and bioinformatics.
7) How do I choose the right clustering algorithm?
| Question | Recommended Algorithm |
| Data has noise or outliers? | DBSCAN |
| Need to specify K in advance? | K-Means |
| Want a hierarchical structure? | Agglomerative Clustering |
| Need probabilistic cluster assignment? | Gaussian Mixture Models (GMM) |
8) What is the best clustering algorithm for large datasets?
For large datasets, three options handle scale well: Mini-Batch K-Means (fast, approximate results), BIRCH (memory-efficient), and HDBSCAN (scalable density-based clustering). The right choice depends on whether your data contains noise and whether you know the number of clusters in advance.
9) How do I do cluster analysis in Python?
Use scikit-learn's KMeans class: import KMeans, fit it on your scaled data, then use silhouette_score to evaluate cluster quality. A full working example, including real output on a public dataset, is covered in the Python implementation section above.
10) What is the difference between cluster analysis and classification?
Classification uses labeled training data to assign predefined categories to new data points. Cluster analysis is unsupervised: it discovers groupings directly from the data, with no prior labels involved.
Cluster Analysis | Classification | |
| Learning type | Unsupervised, no labels required | Supervised, requires labeled training data |
| Goal | Discover hidden groupings in the data | Predict a known category for new data |


