How to Handle Bad Data in Production Pipelines with Confidence
A hands-on guide to managing bad data in production pipelines with real-world tools and recovery patterns.
Data Analytics and Business Intelligence
How to Handle Bad Data in Production Pipelines with Confidence
A hands-on guide to managing bad data in production pipelines with real-world tools and recovery patterns.
Table of contents
Table of contents
Introduction
Types of Bad Data and Common Data Quality Issues
How to Detect Bad Data in Production Pipelines: 5 Key Strategies
Resilience and Recovery Patterns for Handling Bad Data in Production Pipelines
Top 5 Tools to Monitor and Manage Bad Data Quality in Asset Management
Conclusion
FAQs
Introduction
Bad data doesn’t just stay in the background; it impacts everyday business decisions, customer satisfaction, and compliance. According to IBM, poor data quality costs companies approximately $15 million each year. MIT Sloan notes that it can consume 15% to 25% of a company’s revenue. These numbers reflect real-world problems, including missed sales, inaccurate forecasts, wasted marketing budgets, and legal risks.
From wrong product details to outdated customer records, bad data affects operations at every level. Over time, this leads to a decline in trust, lost revenue, and stalled innovation, particularly in areas such as poor data quality and asset management, where accuracy is crucial.
This blog explores the types of bad data and common quality issues, strategies for detecting them in production pipelines, patterns for building resilience and recovering quickly, and tools that help monitor and manage data quality in asset-heavy environments.
Types of Bad Data and Common Data Quality Issues
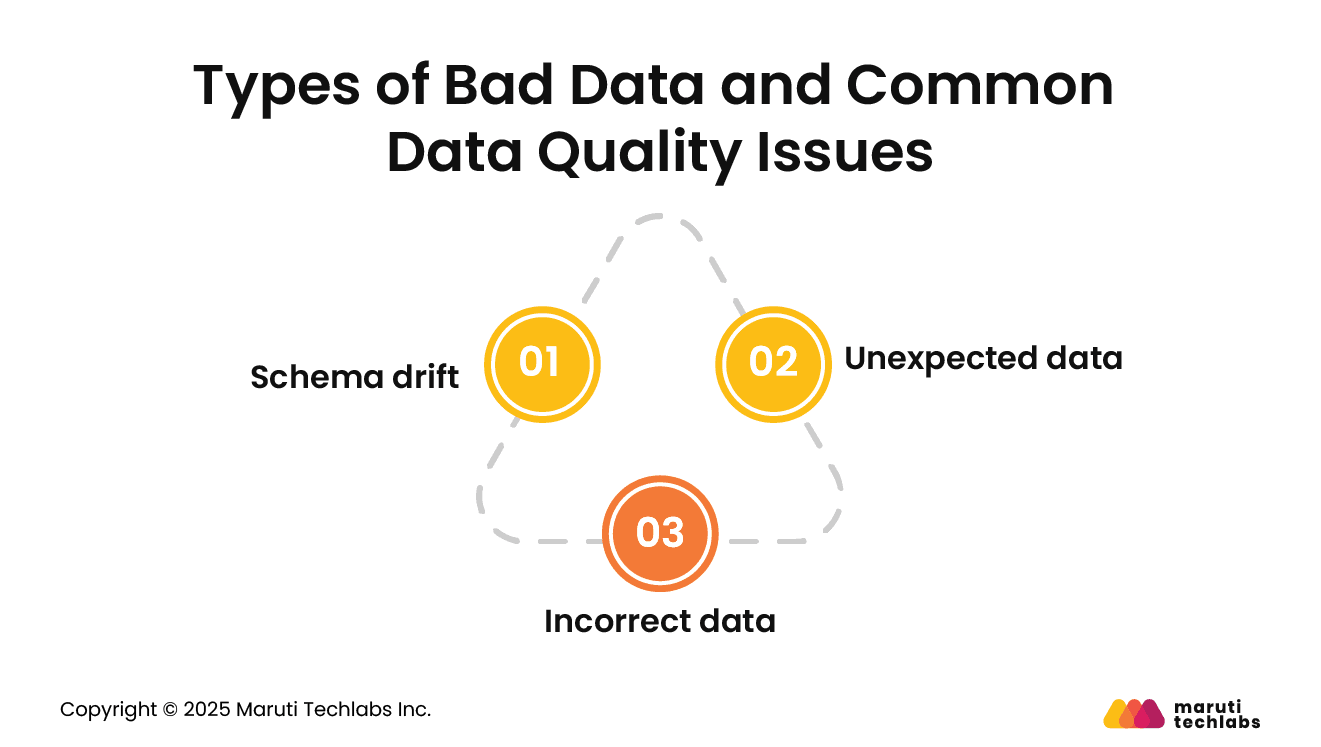
As data flows through pipelines, it often comes from different sources that change over time. These changes can cause issues that affect data quality without anyone noticing right away. Here are some of the most common types of bad data seen in production:
Schema drift: This happens when the structure of the incoming data changes suddenly. For example, if a column is added, removed, or renamed in a source table, it can disrupt the pipeline's logic. A small change like this can affect dashboards, reports, and even machine learning models that depend on that data.
Unexpected data: Sometimes data arrives in the wrong format or type. You might expect a number but get a string, or find empty (null) values where they shouldn’t be. These issues may not immediately halt the pipeline, but they can cause trouble during transformations or reporting later on.
Incorrect data: Even when the data format is proper, the actual values can still be wrong. For example, an age field showing 250, or a product price being ten times higher than it should be. These mistakes lead to incorrect decisions and poor business outcomes.
Such issues are common in growing systems, so it’s essential to identify and address them early.
How to Detect Bad Data in Production Pipelines: 5 Key Strategies
In production pipelines, bad data often goes unnoticed until it causes delays, broken reports, or wrong decisions. To avoid this, detection needs to be proactive and well-structured. Here are five key strategies to spot issues early and maintain reliable data flows.
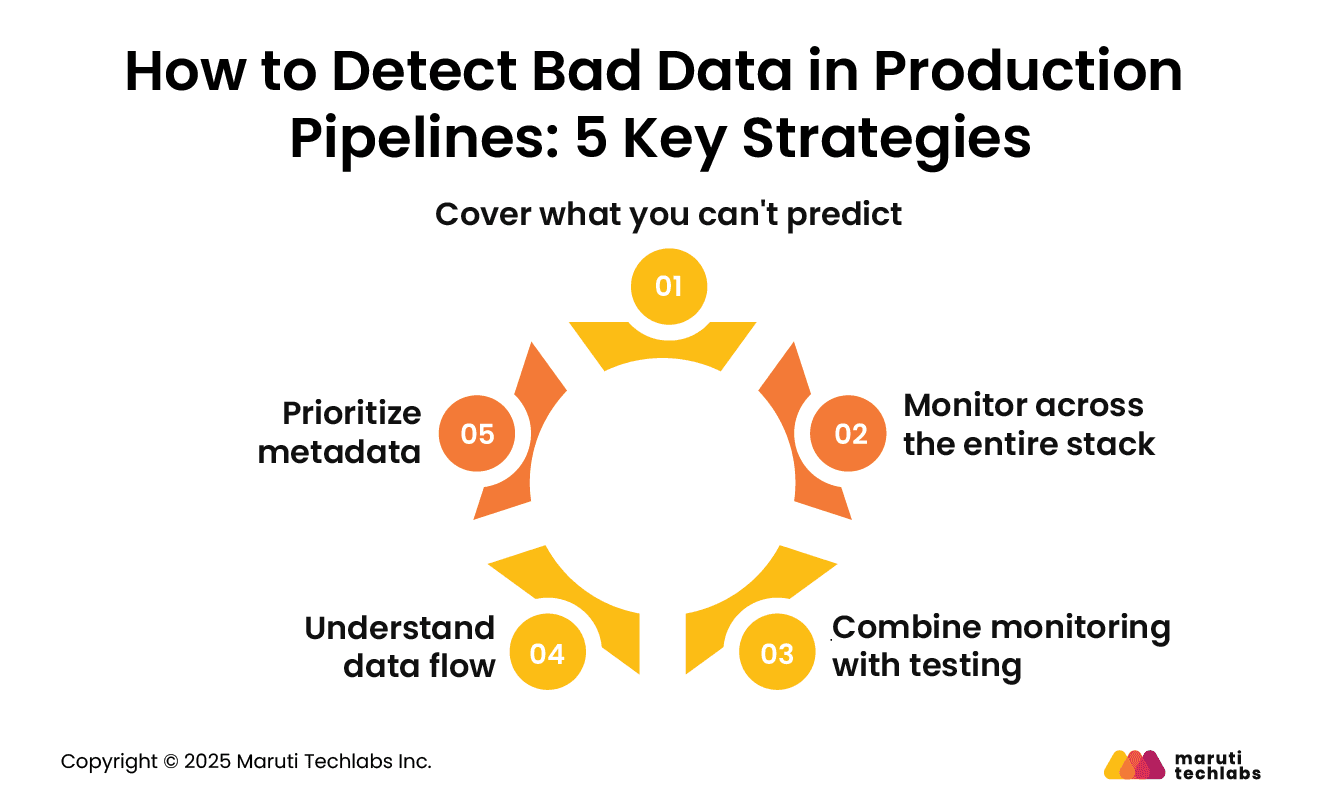
1. Cover what you can't predict
Standard data tests, such as unit tests or hardcoded rules, are useful but limited. It’s impossible to write tests for every possible failure. That’s where machine learning-based monitoring helps. These tools can understand the usual behavior of your data and flag unusual patterns or changes that weren’t expected, catching what traditional testing may miss.
2. Monitor across the entire stack
Monitoring should not focus only on a few known tables. You need broad, automatic coverage across all production tables and systems, from ingestion to final dashboards. Monitoring tools should verify schema changes, data freshness, fluctuations in row counts, spikes in null values, and unusual distributions of values. This level of visibility helps detect problems anywhere in the pipeline, not just at fixed checkpoints.
3. Combine monitoring with testing
Testing remains an essential first line of defense. Schema validation, custom data rules, and referential integrity checks can catch common problems early. When combined with monitoring, it provides your team with both depth and coverage, ensuring that known risks are thoroughly tested and unknown risks are promptly detected.
4. Understand data flow
Data lineage illustrates how data flows through the pipeline and where it is utilized. If a change is made to a field upstream, lineage helps identify what dashboards, models, or reports might be affected. This visibility is key for managing changes and resolving incidents quickly.
5. Prioritize metadata
Metadata gives you context. It explains how data is used, who relies on it, and what it is connected to. Treating metadata as a critical part of your pipeline helps reduce confusion, prevent mistakes, and improve collaboration across teams.
Resilience and Recovery Patterns for Handling Bad Data in Production Pipelines
Handling bad data isn’t just about catching problems. It’s also about keeping your pipeline running and recovering gracefully when something goes wrong. Below are some practical patterns that help build resilient data systems and reduce downtime.
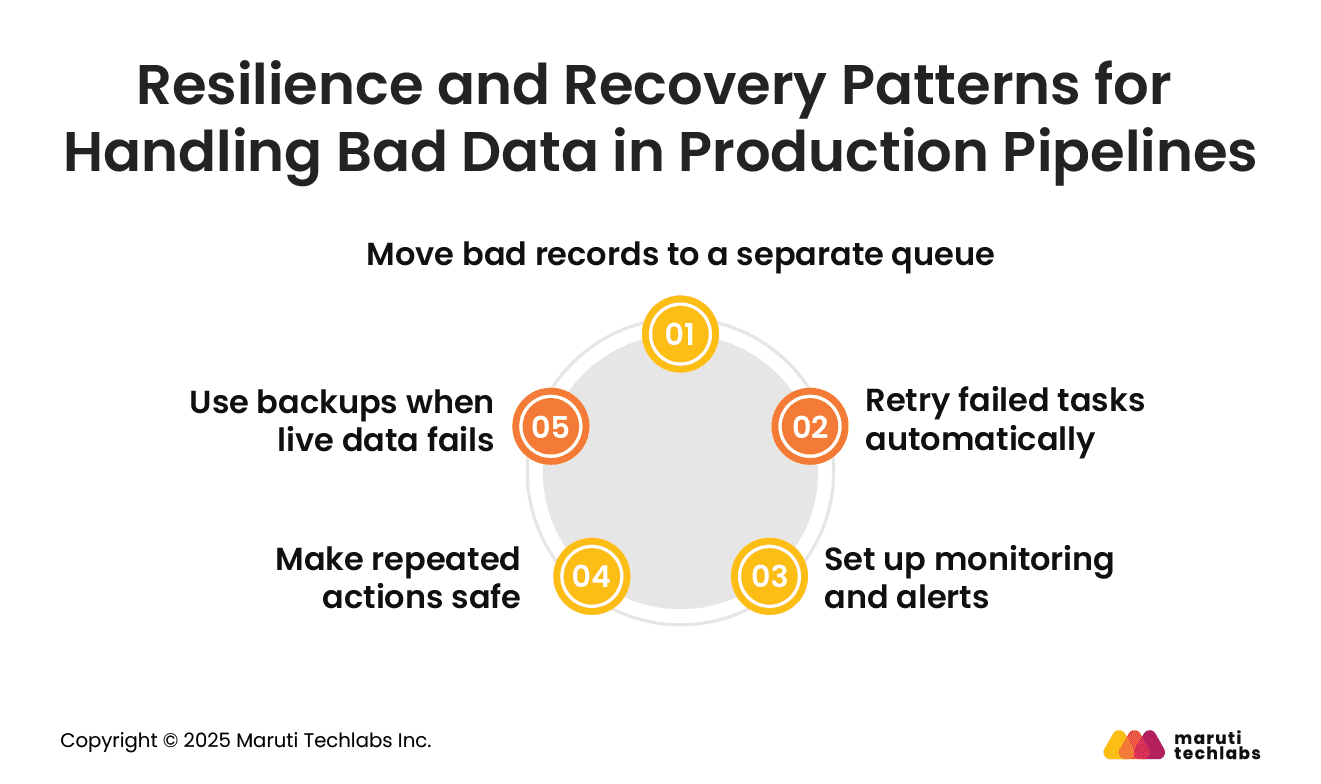
1. Move bad records to a separate queue
When data fails validation or causes errors, it can be moved to a dead-letter queue. This prevents the pipeline from getting blocked. Teams can check the failed records later, fix the issue, and reprocess them without losing any data. This approach is particularly useful for event streaming platforms but is also effective across various systems.
2. Retry failed tasks automatically
Some errors are temporary, like a network timeout or a service being briefly unavailable. Retry logic enables the system to attempt the operation again after a brief delay. This helps avoid failures due to short-term issues and ensures the data continues to flow.
3. Set up monitoring and alerts
Detecting issues early is key. With proper monitoring in place, the system can alert teams immediately if something unusual occurs. Alerts can be sent through Slack, PagerDuty, or other tools, allowing someone to respond before the issue escalates.
4. Make repeated actions safe
If a task runs more than once, it shouldn’t create duplicate entries or break downstream processes. Designing idempotent operations ensures repeated actions don’t cause inconsistencies.
5. Use backups when live data fails
Fallback mechanisms allow the system to continue working even if the main data is broken or missing. For example, if a value is missing, the system can use a default or retrieve a recent past value to maintain smooth operation.
Top 5 Tools to Monitor and Manage Bad Data Quality in Asset Management
Monitoring and managing bad data is particularly crucial in asset-intensive environments, where poor data quality can lead to significant business issues. The following tools help teams identify data issues early, understand their impact, and take prompt action to resolve them.
Monte Carlo is a platform designed to enhance the reliability of your data. It utilizes machine learning to identify what constitutes good data and then alerts you when something appears to be off. If bad data causes a delay or a broken report, Monte Carlo helps track it, measure the impact, and notifies the right teams to fix it quickly.
Acceldata offers three powerful tools—Pulse for performance, Torch for reliability, and Flow for pipeline tracking. It helps spot problems before they occur and works well with tools already in your data stack. You can also track every data asset across systems, making it easier to identify where issues originate.
Part of Cisco, AppDynamics connects how your apps are performing with how your business is doing. It helps you find the root cause of performance problems and spot any issues in code, servers, or networks. You can also monitor the entire infrastructure in real time and see how it affects your users.
CloudWatch helps you monitor all your AWS resources. It collects and displays data in real-time and allows you to set alerts when something unusual occurs, such as high CPU usage. It’s fully integrated with AWS and doesn’t need a complex setup.
Datadog provides a comprehensive view of your apps, infrastructure, and services. It consolidates logs, metrics, and traces into a single location. You can spot problems early, run tests, and troubleshoot quickly, all without writing any extra code.
Conclusion
Bad data is a part of every growing system; it’s nearly impossible to avoid altogether. What matters is how quickly you detect it and how well your systems respond when it appears. With the right mix of monitoring, testing, and resilience patterns, such as dead-letter queues, retries, and fallback mechanisms, teams can maintain healthy pipelines and trustworthy data.
Tools like Monte Carlo, Acceldata, and Datadog make it easier to manage data quality, particularly in asset-intensive environments where accuracy is crucial.
At Maruti Techlabs, we help businesses build robust, scalable data pipelines that are ready for real-world challenges. From early detection to recovery, our data engineering services are designed to improve data reliability at every stage.
Looking to build more resilient data systems? Explore our Data Engineering Services or contact us to initiate a conversation.
FAQs
1. What is good data vs bad data?
Good data is accurate, complete, timely, and fits the expected format. It supports reliable decisions and smooth operations. Bad data, on the other hand, is incorrect, missing, outdated, or poorly formatted, leading to errors, confusion, and poor outcomes across business processes and analytics.
2. How to improve bad data?
Improving bad data begins with cleaning, correcting errors, filling in missing values, and standardizing formats. Use validation rules, automated tests, and monitoring tools to prevent future issues. Adding context with metadata and improving data entry practices also helps maintain quality over time.
3. How do you identify bad data?
Bad data can be spotted through validation checks, monitoring tools, and manual reviews. Look for null values, incorrect formats, unusual patterns, or out-of-range values. Data testing and anomaly detection tools can automatically flag these issues before they cause downstream problems.
4. What are the data quality issues in ETL?
Common ETL data quality issues include schema mismatches, missing or duplicated records, transformation errors, incorrect data types, and inconsistent values. These problems often arise from changes in source data, poor mapping logic, or failures during extraction, transformation, or loading processes.
Pinakin Ariwala has over 20 years of experience in AI/ML, data engineering, and software development. He has led AI and machine learning projects across industries, including agriculture, finance, and healthcare, and has been featured on the Clutch Leaders Matrix podcast discussing real-world AI/ML applications.
Stuck with a Tech Hurdle?
We fix, build, and optimize. The first consultation is on us!