

Predictive Analytics in Insurance: Use Cases, Examples & Benefits
Key Takeaways
- Predictive analytics in insurance uses historical and live data to forecast claim likelihood, claim severity, fraud, and customer churn before they happen.
- It pays off: in WTW's 2026 survey, P&C insurers that invested more in advanced analytics and AI ran combined ratios six percentage points lower than slower adopters.
- Pricing is mature, claims are not: close to 80% of surveyed insurers use advanced rating and pricing models, but only 33% use advanced analytics for claims fraud detection.
- The biggest use cases are underwriting, pricing, claims triage, fraud detection, retention, and catastrophe and loss forecasting.
- Examples differ by line of business: telematics in auto, weather and sensor data in property, accelerated underwriting in life, and utilization and fraud models in health.
Insurers are betting on predictive analytics because it makes pricing, claims, and fraud decisions more accurate and earlier in the process. Predictive analytics in insurance trains models on past policies, claims, and customer behavior, then scores new cases as they arrive. Every premium is a bet on future claims, so a sharper forecast flows straight into margin.
This is no longer experimental. According to WTW's 2026 Advanced Analytics and AI Survey, close to 80% of insurers rely on advanced rating and pricing models, and carriers that invested more in analytics achieved combined ratios six percentage points lower between 2022 and 2024.
The gap is in everything after pricing. The same survey found that just 33% of carriers use advanced analytics for claims fraud detection and 29% for severity assessment. Closing that gap takes data engineering, statistics, and machine learning working together, which is why many insurers pair internal teams with a partner for custom AI and ML development.
This guide explains how insurance predictive analytics works, where it delivers value, examples by line of business, how to implement it step by step, and how we applied it for a US insurance broker.

Our data analytics consulting team maps your data, systems, and high-value use cases into a practical starting plan.
Predictive Analytics in Insurance: From Hindsight to Foresight
Predictive analytics in insurance uses statistical techniques and machine learning on historical and real-time data to estimate the probability of future events, such as a claim, a fraudulent submission, a lapse, or a large loss. The output is usually a score or a forecast that a person or a system acts on.
It helps to separate it from the analytics that came before it:
- Descriptive analytics reports what happened, such as last quarter's loss ratio.
- Diagnostic analytics explains why it happened, such as which segment drove the loss ratio up.
- Predictive analytics estimates what is likely to happen next, such as which open claims will become expensive.
- Prescriptive analytics recommends the action to take, such as routing a claim to a senior adjuster.
Most insurers already run the first two. The value of predictive work comes from moving the decision earlier, to quote time, first notice of loss, or the renewal window, when there is still room to change the outcome.
Predictive Modeling in Insurance: From Raw Data to a Live Score
Insurance predictive modeling uses a repeatable pipeline that includes data collection, preparation, training, validation, deployment of the best model into a process, and monitoring. The quality of the inputs and the application of the output are more important than the modeling decision.
- Collect data. Policy and claims history, billing records, customer interactions, and external sources such as weather, property, telematics, and credit-based data.
- Prepare features. Clean the data, resolve duplicates across systems, and turn raw fields into useful signals, such as claim frequency over 24 months or days since last contact.
- Train and compare models. Generalized linear models remain common for regulated rate filings because they are easy to explain. Gradient boosting and other machine learning methods are often chosen for fraud and underwriting scoring because they capture non-linear patterns. WTW's survey found gradient boosting machines are still the go-to for underwriting scoring and fraud detection.
- Validate. Test on data the model has never seen, check performance across customer segments, and confirm results are stable over time.
- Deploy into a workflow. A score nobody sees changes nothing. Embed it in the quoting screen, the claims queue, or the retention call list.
- Monitor. Models drift as behavior, fraud tactics, and the economy change, so track accuracy and retrain on a schedule.
Where Insurers Gain the Most from Predictive Analytics
Insurers gain the most in pricing accuracy, loss and expense ratios, fraud detection, service speed, and retention. The common thread is better decisions made earlier and at scale.
- More accurate pricing. Models separate genuinely different risks, so low-risk customers are not subsidizing high-risk ones and the book stays competitive without leaking margin.
- Lower loss and expense ratios. Better selection at underwriting and faster triage at claims reduce both leakage and handling costs.
- Earlier fraud detection. Suspicious claims are flagged at intake instead of after payout.
- Faster, fairer service. Simple claims move quickly while experienced adjusters spend time on complex ones.
- Stronger retention. Churn scores show who is likely to leave and why, while there is still time to act.
The financial evidence is real but should be read carefully. WTW's finding is a correlation across 59 North American P&C carriers, not a guarantee, and the report is explicit that using AI without a solid data foundation can worsen existing problems.
Six Predictive Analytics Use Cases Across the Insurance Value Chain
The six highest-value use cases are underwriting, pricing, claims triage, fraud detection, customer retention, and loss forecasting. Each one moves a decision earlier, when there is still room to change the outcome.
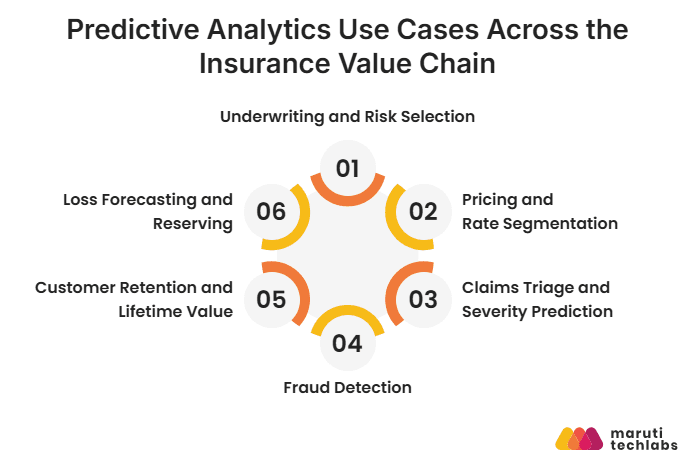
1. Underwriting and Risk Selection
Models score each submission on expected loss so that straightforward risks can be quoted and bound quickly while borderline ones go to an underwriter. WTW reports that only 16% of insurers currently use AI in underwriting decisions, while 60% plan to prioritize it by 2028, so this is where the next wave of adoption sits.
2. Pricing and Rate Segmentation
Pricing is the most established use. Insurers combine traditional rating factors with behavioral and external data to set premiums closer to true risk, and many now test price elasticity to understand how customers react to changes at renewal.
3. Claims Triage and Severity Prediction
At first notice of loss, a model can estimate how large a claim is likely to become and who should handle it. Low-complexity claims can go straight through, while claims showing early signs of severity or litigation are assigned to senior adjusters. Our article on machine learning in insurance claims walks through the workflow in detail.
4. Fraud Detection
Fraud models rank claims by likelihood of being fraudulent so investigators spend time where it counts. The threat is also changing. In Verisk's State of Insurance Fraud Study, 98% of insurers agreed that AI-powered editing tools are fueling a rise in digital media fraud, and 65% reported using automated AI-based detection tools from third parties. Predictive scoring on claim patterns, combined with image and document checks, is becoming a baseline defense.
5. Customer Retention and Lifetime Value
Lapse and churn models look at signals such as premium changes, service contacts, late payments, and quote-shopping behavior. The retention team then focuses on the customers who are both at risk and worth keeping, instead of discounting across the board.
6. Loss Forecasting and Reserving
Forecasting claim frequency and severity helps actuarial and finance teams set reserves and plan capital. In catastrophe-exposed lines, models combining weather, geospatial, and property data help carriers estimate exposure before a season begins.
Insurance Predictive Analytics Examples by Line of Business
The techniques are the same across lines, but the data and the first use case differ: auto uses telematics, property uses weather and sensor data, commercial lines score submissions, life speeds up underwriting, and health manages utilization and fraud. The scenarios below are illustrative of how carriers typically apply them.
| Line of business | Typical data | Predictive use case | What it changes |
| Personal auto | Telematics, vehicle, driver history | Usage-based pricing and accident-risk scoring | Premiums reflect how and how much someone drives |
| Homeowners and property | Property attributes, weather, geospatial, sensors | Catastrophe exposure and water-damage or fire risk models | Better selection and targeted loss prevention |
| Commercial lines | Firmographics, loss runs, submission documents | Submission scoring and appetite matching | Underwriters prioritize the best-fit risks first |
| Life | Application data, prescription and lab data, mortality tables | Accelerated underwriting and lapse prediction | Faster decisions with fewer medical exams |
| Health | Claims, utilization, provider and member data | Utilization management, disease management, and fraud detection | Earlier intervention and fewer improper payments |
Predictive Analytics in Health Insurance
Health insurance shows how widespread these methods have become. The NAIC's Health AI/ML Survey, covering 93 insurers across 16 states, found that 84% of health insurers use AI and machine learning in some capacity. Reported uses included utilization management, disease management programs, prior authorization, claims fraud detection, and provider fraud detection.
The same survey found that nearly 92% of health insurers have AI governance principles modeled on the NAIC's. That matters because health data is sensitive and decisions such as prior authorization affect patients directly. Models here need audit trails, human review of consequential decisions, and regular bias testing from day one.
An Auto Example in Practice
Think about a personal auto insurer that has access to telematics data. The model trained based on trip-level signals such as hard braking, driving at night, and phone usage predicts accident risk more accurately than age and zip code.
With the help of this model, the insurer can give lower rates to safe drivers, offer advice to drivers at risk, and file reasonable rates with the regulators. The most valuable things here are three things that function together: a good model, the data that has been verified, and the process that produces good results.
A Practical Plan to Roll Out Predictive Analytics, Step by Step
Roll out predictive analytics in five steps: pick one measurable use case, fix the data behind it, build and validate the model, put governance in place, then integrate and scale what works.
Step 1: Pick One Use Case with a Clear Baseline
Choose a high-volume process where you can measure the before and after, such as claims triage time, quote-to-bind rate, or the share of investigated claims confirmed as fraud. A narrow start builds trust faster than a broad program.
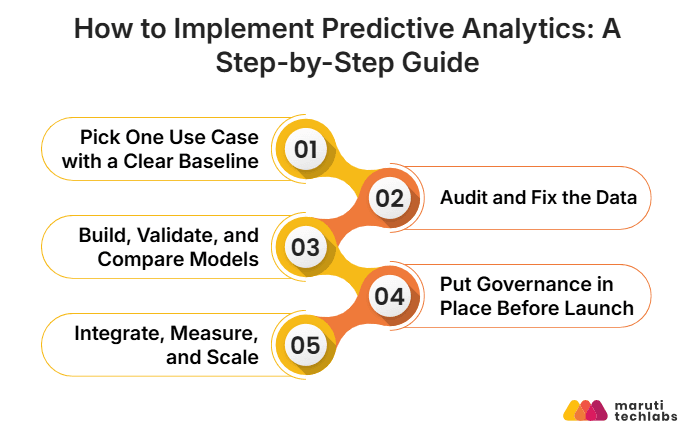
Step 2: Audit and Fix the Data
List where the required data lives, who owns it, and how consistent it is across policy, claims, and billing systems. Data problems are the most common blocker: 42% of insurers in WTW's survey reported data-related issues, such as poor quality and limited accessibility, as a significant barrier. If you need a structured starting point, our data maturity assessment shows where the gaps are.
Step 3: Build, Validate, and Compare Models
Start with a simple benchmark model, then test more advanced ones against it. Keep the version that performs best on unseen data and that your actuaries and regulators can understand.
Step 4: Put Governance in Place Before Launch
Keep a list of all models and their data inputs, check against data discrimination, and define who can approve the model. The model bulletin of the NAIC on the use of AI by insurance companies has been adopted in 30 states, and insurance companies are accountable for third-party models.
Step 5: Integrate, Measure, and Scale
Deliver the score inside the tools people already use, track the baseline metric from Step 1, and review monthly. When the first use case proves out, reuse the data pipelines and monitoring for the next one.
Common Roadblocks and How to Get Past Them
The five most common roadblocks are fragmented data, explainability, bias, skills gaps, and model drift, and each has a practical fix.
- Fragmented data. Policy, claims, and customer data often sit in separate legacy systems. Solve this with a shared data model before building more models.
- Explainability. Regulators and customers expect reasons for pricing and claims decisions. Use interpretable models where rules require it, and explanation tooling where more complex models are justified.
- Bias and fairness. Models can pick up proxies for protected characteristics. Test outcomes across groups and retest after every retrain.
- Skills and strategy gaps. In WTW's survey, only 20% of insurers reported a well-defined analytics strategy and just 12% regularly offered analytics training, so adoption often stalls at the handoff from data teams to business teams.
- Model drift. Customer behavior and fraud tactics shift, so a model that was accurate at launch degrades without monitoring.
Final Thoughts
Insurance firms are able to convert past statistics into future, better, and quicker decisions in risk-taking, pricing, claims, fraud detection, and customer retention due to predictive analysis. Pricing analysis is used extensively, while fraud detection, risk-taking, and claims adjustment are the spheres where the majority of insurers still need improvement.
The companies that achieve the best results tend to follow the same principle. They take one concrete project, correct the existing information, control the model, and then only expand their activity once they have obtained success with the first project.
Case Study: How We Cut Underwriting Time by 40% for a US Insurance Broker
We built a Python-based, AI-powered OCR pipeline for one of the largest insurance brokers in the United States, reducing underwriting processing time by 40%. Reliable, structured data is what predictive models run on, so this project shows what the foundation looks like in practice. You can read the full insurance underwriting OCR automation case study.
The Challenge
Underwriters were verifying customer documents by hand. That was slow, prone to errors, and a source of customer drop-off as volumes grew.
- Manual document review. First notice of loss documents, bank statements, credit scores, and other printed or handwritten records had to be read by people.
- Cross-verification. Driver's licenses, vehicle registrations, and policy details had to be checked against original customer information.
- Growing volumes. More applications meant more manual workload.
- Error risk. Missing information and inconsistencies could affect underwriting decisions and cost the client customers.
Our Approach
We validated the approach with a time-constrained proof of concept before committing to a full build.
- Worked with the client's team to understand the underwriting workflow and where AI could remove manual effort.
- Built a three-stage OCR pipeline covering image preprocessing, text detection, and character recognition.
- Cross-referenced extracted data with registered customer credentials and flagged inconsistencies or missing information for manual review.
- Tested against client-provided data and multiple use cases before deploying to the client's online platforms.
The Outcome
The solution cut underwriting processing time by 40% and made document handling available around the clock.
- 40% lower processing time for automated underwriting tasks.
- 24x7 document processing, with applications handled in parallel without continuous human intervention.
- Improved data accuracy, with document classification and automated verification reducing errors and duplicate data.
- Stronger risk management, as risk scoring and fraud insights strengthened underwriting security.
Talk to our AI and insurance engineering team about the right first use case for you.
FAQs
1. What is the difference between predictive analytics and predictive modeling in insurance?
Predictive modeling is the technical step of building a statistical or machine learning model that produces a score or forecast. Predictive analytics is the broader practice around it: defining the business question, preparing data, building the model, putting the output into a workflow, and measuring the result. A model on its own does not change outcomes. The analytics process around it does.
2. How is predictive analytics different from traditional actuarial analysis?
Predictive analytics extends actuarial analysis with machine learning, more granular data such as telematics or documents, and individual-level scoring. Actuarial analysis typically relies on structured data, established statistical methods, and aggregated risk classes, and it remains essential for pricing and reserving. In practice, the two work together, with actuaries validating that model outputs are sound, stable, and defensible to regulators.
3. How much data does an insurer need to start?
For the model to learn from, you must have a sufficient number of historical records with dependable results, such as verified fraud or ultimate claim cost. Volume is not as important as quality and consistency. MGAs and smaller insurers may start with a small, clearly defined dataset or add other sources to their own data.
4. Which insurance functions should adopt predictive analytics first?
Start where volume is high, outcomes are measurable, and data already exists. For many carriers, that means claims triage, fraud scoring, or submission prioritization in underwriting. Pricing analytics are already close to universal among P&C carriers, so the larger opportunity often lies in claims and underwriting support.
5. How can insurers keep predictive models compliant and free from unfair bias?
Maintain a model inventory, document data sources and assumptions, test results across customer groups, keep humans involved in consequential decisions, and monitor performance after launch. Regulators expect insurers to stay accountable even when a third party built the model, so contracts should also guarantee access to documentation and testing results.
6. How long does it take to see results from predictive analytics?
A focused use case with accessible data can show measurable results within a few months, especially if it starts as a time-boxed proof of concept. Enterprise-wide programs that require data consolidation or core system changes take longer. Plan in waves, prove one use case, then reuse the pipelines and governance for the next.
7. Do insurers need to build predictive models in-house or work with a partner?
Build in-house where the model is core to how you price or select risk, and partner when you need speed or specialized skills in data engineering, machine learning, or document AI. Whichever route you choose, keep ownership of your data and clear documentation of the model.


