Introducing Observability in DAG Workflows for US Tech Teams
Explore common debugging pitfalls & 8 simple steps to enhance visibility with DAG workflows.
Data Analytics and Business Intelligence
Introducing Observability in DAG Workflows for US Tech Teams
Explore common debugging pitfalls & 8 simple steps to enhance visibility with DAG workflows.
Table of contents
Table of contents
Introduction
Understanding DAG-Based Workflows
Why are DAGs Important?
Common Debugging Pitfalls in DAG Workflows
Understanding Observability in DAG Context
8 Steps to Build Data Observability into DAG Workflows
Top 4 Benefits of Observability in DAG Workflows
Conclusion
FAQs
Introduction
Debugging modern DAG-based data workflows can be challenging due to their complexity, asynchronous tasks, and numerous interdependencies.
In case of failures, discovering the root cause often requires sifting through scattered logs, understanding upstream and downstream impacts, and dealing with partial data states. This slows incident resolution, impacts data quality, and erodes stakeholder trust in analytics systems.
Observability offers a powerful solution. By incorporating observability into DAG workflows, teams gain real-time insights into task execution, performance metrics, and data lineage. Observability transforms opaque data pipelines into transparent, manageable systems that support reliability and continuous improvement.
To help you enhance observability in your data pipelines, we bring you this read, which discusses common pitfalls of DAG workflows, the difference between observability and monitoring, and steps to build data observability into your DAG workflows.
Understanding DAG-Based Workflows
A DAG is a directed graph that consists of nodes that depict a particular task, and edges define the dependencies between them with no directed cycles.
A DAG, or Directed Acyclic Graph, is a structure where one-way edges connect nodes and form no cycles.
Each edge in a DAG has direction, meaning data flows in one direction, ensuring processes don’t repeat or loop back.
DAGs organize workflows into clear, traceable steps, making them ideal for task scheduling, data pipelines, and dependency management.
Why are DAGs Important?
DAGs matter because they enhance efficiency by enabling parallel execution of independent tasks, simplify workflows through clear visual representation, and ease debugging.
Their modular design promotes reusability, allowing components to be leveraged across different projects or experiments, making data workflows more scalable and maintainable.
Common Debugging Pitfalls in DAG Workflows
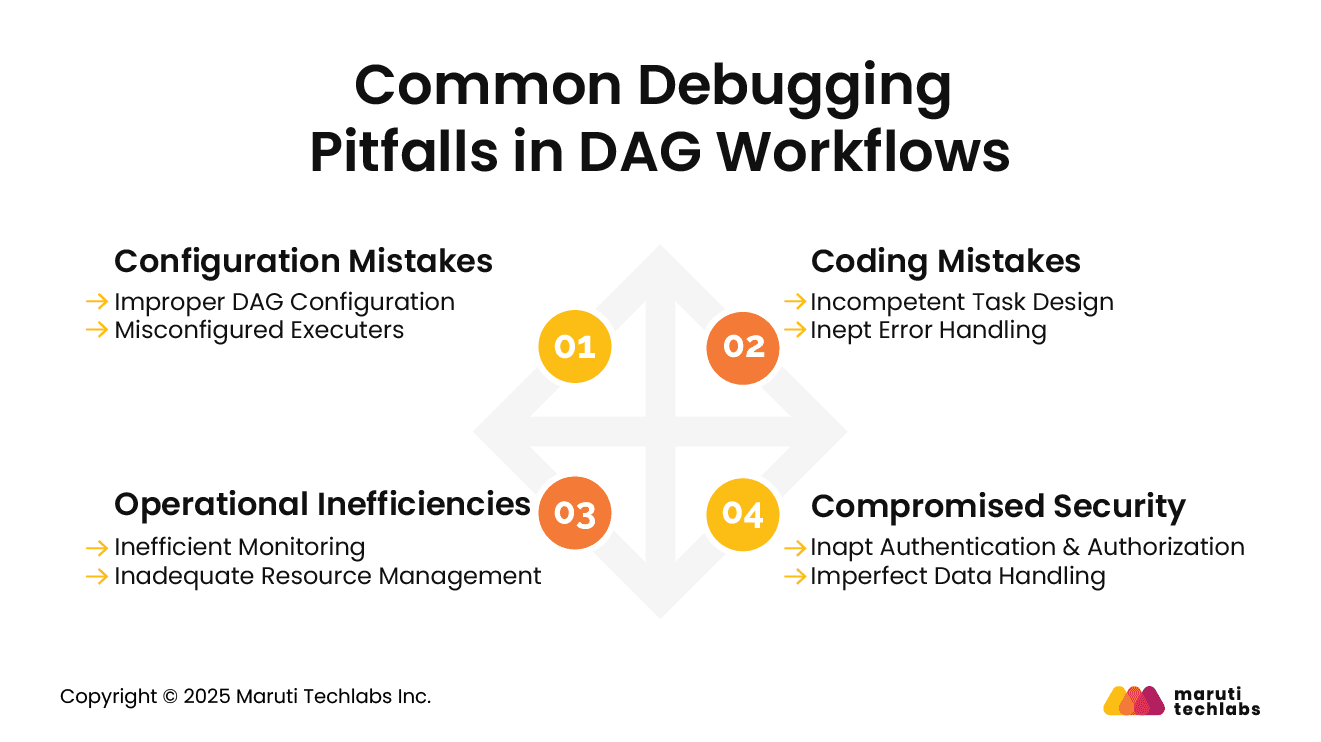
Here are the top 4 debugging pitfalls to avoid with DAG workflows.
1. Configuration Mistakes
One of the most common areas where configuration errors occur is in the setup of Directed Acyclic Graphs (DAGs), which form the backbone of any workflow orchestration system.
a) Improper DAG Configuration
Workflow failures are often a direct result of incorrect DAG configuration. To avoid circular dependencies, it’s crucial to define explicit dependencies between tasks, each with a unique identifier.
Improve readability by using distinctive names for DAGs and tasks. Ensure synchronicity between the schedule interval and the desired execution frequency.
b) Misconfigured Executers
Misconfigured executors significantly cause performance issues. Depending on your workloads, you should select from different execution strategies, such as local or distributed.
Allocate appropriate resources to facilitate task execution while regularly monitoring executor performance to identify bottlenecks.
2. Coding Mistakes
Coding mishaps can unleash havoc on your systems. Let’s learn how they can affect DAG workflows.
a) Incompetent Task Design
Inefficient designs prevent your workflows from performing at their peak potential. To begin with, it’s important to break complex tasks into smaller, manageable units. Leverage parallel processing while hardcoding tasks with values.
Utilizing parameters and variables can introduce flexibility to tasks. Lastly, extensive tests of tasks should be planned before incorporating them into the primary workflow.
b) Inept Error Handling
Poor error handling leads to unexpected failures. Implement robust error-handling techniques, such as catching exceptions with try-catch blocks, logging errors for easy debugging, alerts to notify of task failures, and timely monitoring of logs to learn recurring issues.
3. Operational Inefficiencies
When workflows span multiple dependencies, even minor blind spots can cascade into larger delays.
a) Inefficient Monitoring
Resource conflicts and missed deadlines are direct results of inadequate monitoring. To ensure optimal operations, utilize tools like Prometheus and Grafana to track system metrics. These tools allow you to set up dashboards and perform regular monitoring.
b) Inadequate Resource Management
Efficient workflows demand adequate resource management. Allocate resources efficiently based on what your tasks require, managing shared resources using resource pools. You can adjust task priorities by optimizing resource allocation and observing stringent monitoring to avoid over-allocation.
4. Compromised Security
In a world where no one is secure online, security today is a primary concern for any organization. Here’s how security oversights can disrupt your DAG workflows.
a) Inapt Authentication & Authorization
Weak authentication and authorization can risk sensitive customer and business information. Enhance your security by updating user credentials regularly, using multi-factor authentication, creating strong password policies, and assigning need-based permissions. In addition, perform timely audits to ensure compliance with security policies.
b) Imperfect Data Handling
Insecure data handling at rest or in transit can have dire consequences. Secure data by implementing protocols like SSL/TLS and HTTPS, prevent hardcoding critical data within DAGs, and save credentials in a safe vault. Lastly, all potential vulnerabilities should be eliminated with constant monitoring and regularly updated security policies.
Understanding Observability in DAG Context
What is Observability?
“Observability is the process of garnering insights into the internal states of systems by analyzing and measuring their interactions across assets. The fundamental aspects of observability are metrics, logs, and traces.”
They can be leveraged to study system behavior, recognize and resolve issues related to performance and security, and, consequently, help enhance system reliability and offer clarity into sophisticated systems by discovering bottlenecks and failures.
What is the Difference Between Observability and Monitoring?
Observability and monitoring serve a common purpose, but in different ways. Monitoring solutions are similar to catching a bird's-eye view of your system’s internals, while observability presents a more detailed view.
For instance, monitoring solutions can be compared with a smartwatch that calculates your heart rate, oxygen level, and more. In contrast, observability is the comprehensive medical examination of your heart or lungs.
Why do we need Observability with Directed Acyclic Graphs (DAGs)?
Observability in DAG is necessary for scrutinizing, debugging, and optimizing data workflows. It ensures reliability and efficiency with real-time insights into data quality, failure, and performance bottlenecks. Observability enhances system trust and maintainability, offering the team visibility into execution patterns and dependencies
8 Steps to Build Data Observability into DAG Workflows
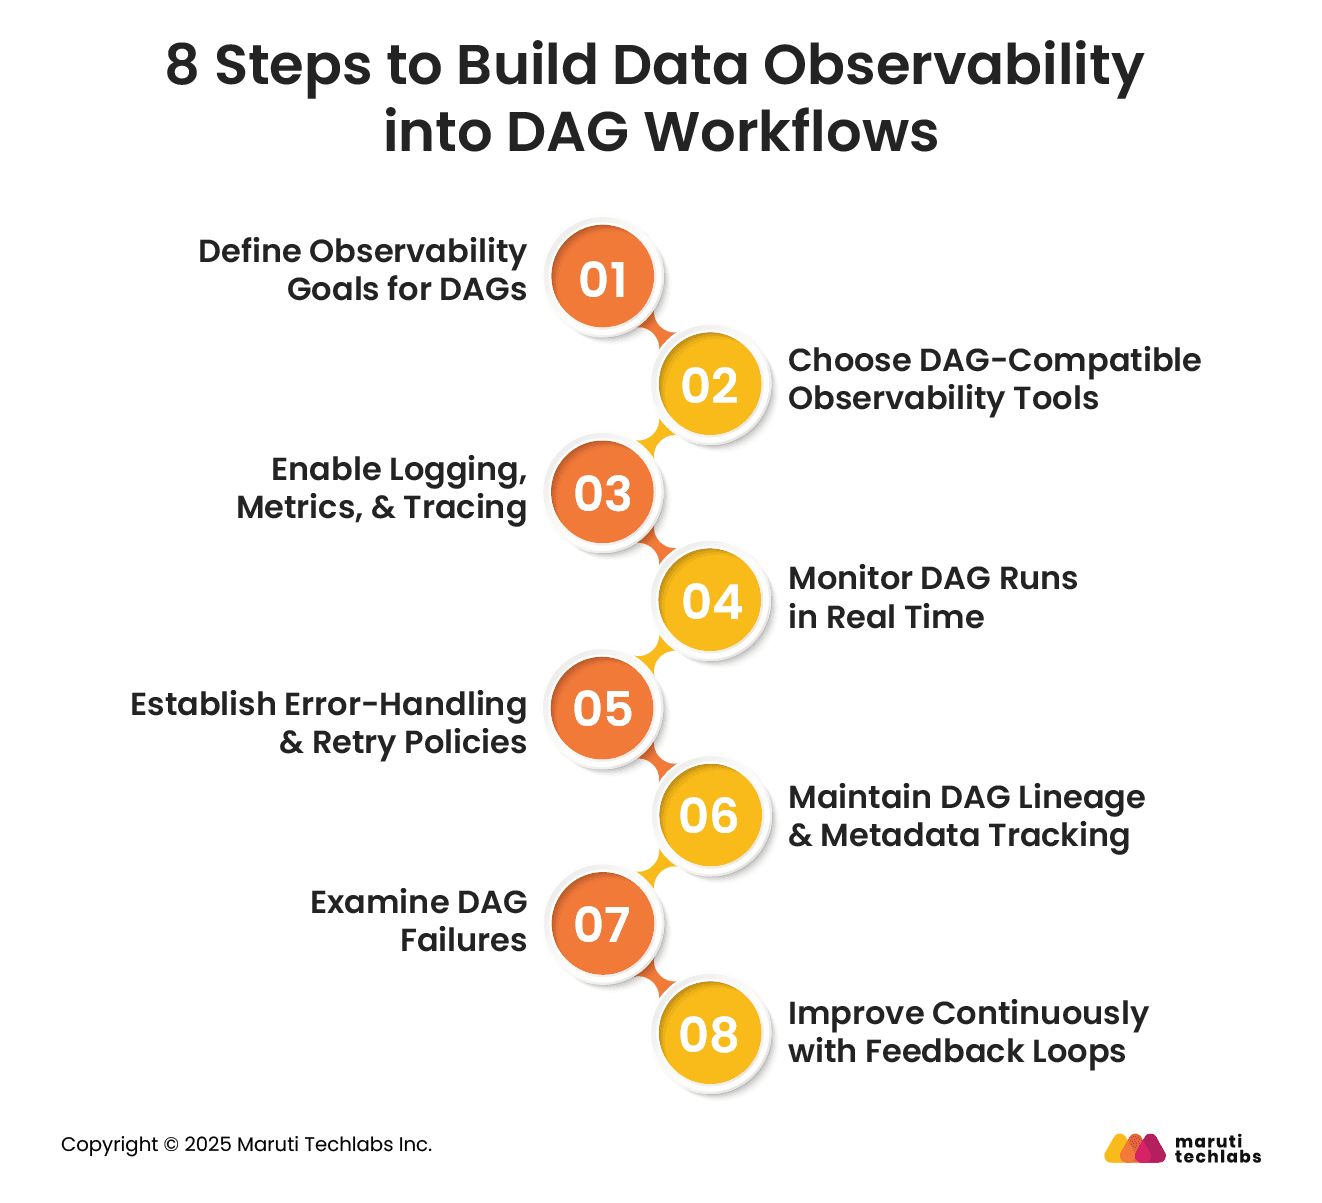
Here is a list of steps that can help you increase observability in DAG workflows.
1. Define Observability Goals for DAGs
Commence this process by clearly defining what a successful workflow looks like. This might include goals such as task reliability, execution time, or data freshness. Defining KPIs allows teams to prioritize the metrics to be monitored, alerts to configure, and evaluation of the data pipeline’s health.
2. Choose DAG-Compatible Observability Tools
Select the tools that integrate well with your orchestration frameworks. They must observe compatibility with logging, metrics, and tracing solutions like Prometheus, Grafana, OpenTelemetry, or in-app orchestration tools. Investing in the correct tools can help visualize performance, track anomalies, and offer desired transparency to debug and optimize workflows.
3. Enable Logging, Metrics, & Tracing
Use structured logs, custom metrics, and trace spans to measure your DAG tasks. Logs reveal intricate task details, metrics offer insights into trends and bottlenecks, and tracing connects events across distributed systems. Together, they present a complete picture of DAG execution, facilitating quicker root cause analysis.
4. Monitor DAG Runs in Real Time
Proactive monitoring is only possible with real-time tracking. Set up dashboards to observe task durations, retries, and failure rates. Leverage streaming logs to respond quickly to anomalies. Monitoring prevents small issues from escalating and maintains SLAs every day.
5. Establish Error-Handling & Retry Policies
Revamp retry policies, timeouts, and fallback mechanisms using robust error-handling techniques. Execute alerts for critical failures and conditional branching for recoverable errors. Consistent handling minimizes manual intervention, ensuring resilience. Observability tools should identify tasks that repeatedly fail or exceed thresholds.
6. Maintain DAG Lineage & Metadata Tracking
Utilize lineage graphs and metadata logs to discover the data flow across systems and between tasks. This offers an understanding of dependencies, traces input and outputs, and audit changes for users. Metadata such as schema versions and timestamps improves traceability and supports data workflows' compliance, debugging, and reproducibility.
7. Examine DAG Failures
Post-incurring failures, conduct a structured review to learn the root cause, analyze the impact, and execute fixes. Identify system gaps and reconstruct events using observability data. Postmortems should not focus on individual accountability but on continuous improvement.
8. Improve Continuously with Feedback Loops
Refine DAGs implementing insights from stakeholder feedback, postmortems, and observability tools. Adjust performance, revise thresholds, and improve monitoring coverage. Treat observability as a living system—adapt as workflows grow in complexity to ensure reliability, efficiency, and trust in your data pipelines.
Top 4 Benefits of Observability in DAG Workflows
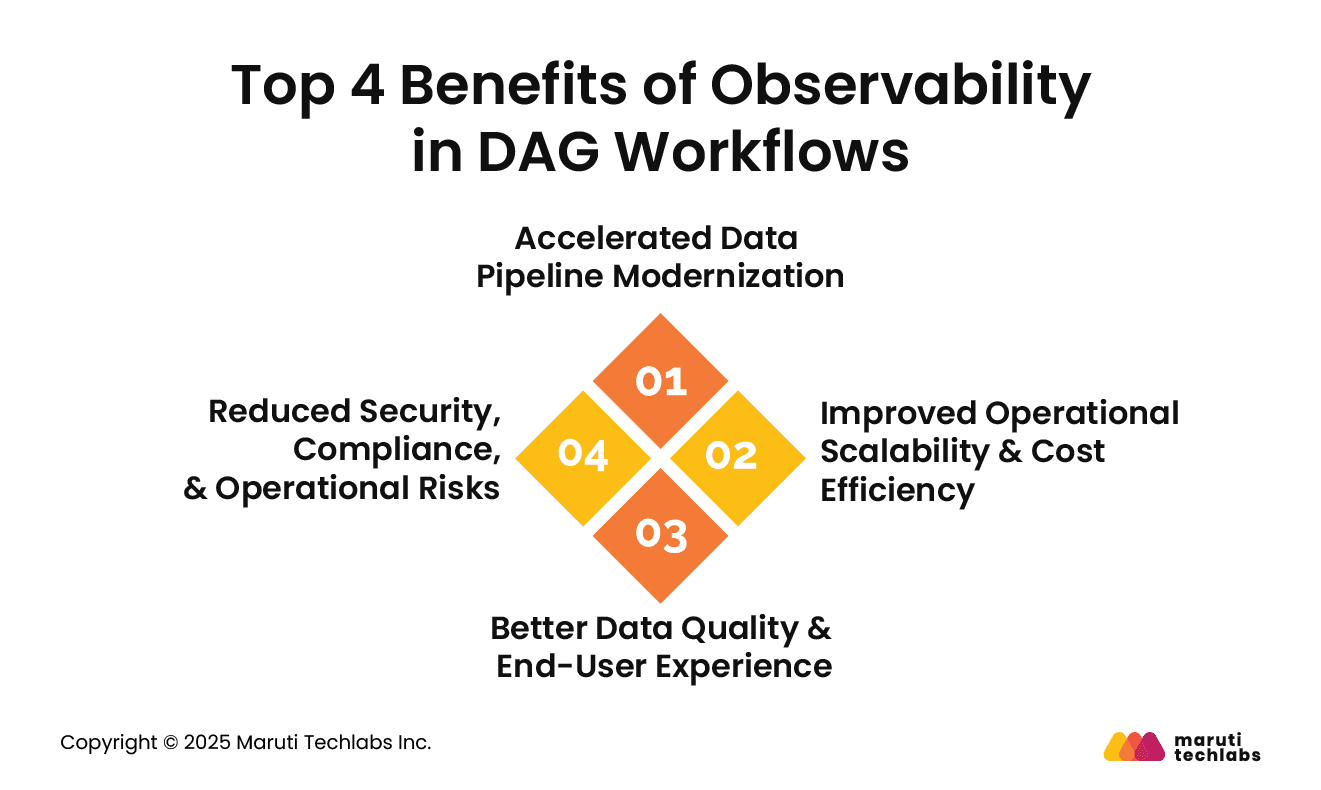
Let’s examine the benefits of introducing observability to DAG workflows.
1. Accelerated Data Pipeline Modernization
Observability enables faster detection of bottlenecks and inefficiencies in DAG workflows, allowing teams to modernize legacy pipelines confidently.
With insights into task behavior, dependencies, and data flow, organizations can streamline redesign efforts and adopt new technologies while transitioning to scalable architectures without compromising reliability or performance.
By monitoring resource usage, task durations, and execution patterns, observability tools help optimize workload distribution and minimize waste. This leads to more predictable scaling and cost-effective operations.
Teams can identify underperforming components, balance compute loads efficiently, and reduce unnecessary retries or over-provisioned infrastructure, improving system performance and cost control.
3. Better Data Quality & End-User Experience
Built-in data checks and real-time monitoring ensure that data is complete, timely, and accurate throughout the pipeline. Observability helps detect and resolve quality issues before they reach downstream users.
Consistent, trustworthy data enhances user confidence, supports better decision-making, and improves the overall experience for data consumers and applications.
Detailed lineage, audit logs, and metadata tracking support compliance with regulatory standards and internal policies. Observability enhances traceability, enabling faster identification of anomalies or unauthorized changes.
Proactive alerting and diagnostics reduce operational risk by allowing teams to respond swiftly to failures, minimizing downtime, data loss, or reputational damage.
Conclusion
Implementing observability from Day 1 in DAG-based workflows is critical for long-term maintainability and scalability. As data pipelines become complex, having built-in observability ensures teams can quickly identify bottlenecks, prevent silent failures, and understand system behavior with metrics, logs, and traces.
This proactive approach enables faster iteration cycles, improving the agility of data teams. Observability also supports scaling by offering visibility into system performance under load, helping teams optimize resources and avoid downtime.
Instead of using monitoring tools after issues arise, embedding observability early builds a solid foundation for reliability and trust. It gives data engineers the insights to maintain high data quality and ensure pipeline consistency as infrastructure evolves.
Observability isn’t just a debugging tool—it’s a strategic investment in building sustainable, high-performance data systems. Being in the business for more than 14 years, our Data Analytics Consulting Services can help you scrutinize your data pipelines and DAG workflows.
Connect with us today and explore the benefits offered by transparent, future-ready data solutions.
FAQs
1. What are the 4 pillars of observability?
The four pillars of observability refer to the core types of data that provide insight into systems' health and performance.
Logs – Detailed records of events for troubleshooting.
Metrics – Numeric data showing system performance over time.
Traces – End-to-end journey of requests across services.
Events – Notable changes or actions in the system.
Each pillar offers a different lens to monitor, debug, and optimize systems effectively.
2. What is the difference between Argo workflows steps and DAG?
In Argo Workflows, steps define a simple, linear sequence of tasks running in a fixed order.
A DAG (Directed Acyclic Graph) allows defining complex dependencies between tasks, enabling parallel execution and branching based on those relationships.
3. What is DAG in orchestration?
A DAG (Directed Acyclic Graph) in orchestration represents workflows where tasks are connected by directed edges that show their execution order without any cycles or loops. It defines dependencies between tasks, ensuring each task runs only after its prerequisites are completed.
This structure allows orchestrators to execute tasks in parallel where possible, optimize workflow execution, and manage complex task relationships efficiently.
About the author
Pinakin Ariwala
Pinakin is the VP of Data Science and Technology at Maruti Techlabs. With about two decades of experience leading diverse teams and projects, his technological competence is unmatched.
Stuck with a Tech Hurdle?
We fix, build, and optimize. The first consultation is on us!