A simple guide to creating cloud dashboards that uncover waste and support cost-saving decisions.
Cloud
How to Build Cloud Dashboards That Save You Money
A simple guide to creating cloud dashboards that uncover waste and support cost-saving decisions.
Table of contents
Table of contents
Introduction
7 Key Metrics That Matter for Cloud Cost Optimization
Design Principles for an Effective Cloud Cost Dashboard
What 5 Tools You Need to Build a Cloud Cost Optimization Dashboard
How Automation Improves Cloud Cost Management
Why Embedding FinOps Into Dev Workflows Supports Cost Savings
Conclusion
FAQs
Introduction
Cloud spending is now a key focus area for most organizations. According to the FinOps Foundation’s 2025 State of FinOps Report, over 50% of respondents identified reducing cloud waste as their top priority. This highlights the persistence of common and costly cloud inefficiencies.
While cloud service provider dashboards do give visibility into usage and costs, they rarely tell the whole story. Especially for private cloud setups, these dashboards often overlook key pieces of information, such as infrastructure costs, software licenses, and ongoing maintenance. What you get is a partial view, which makes it hard to take meaningful action.
There’s a big difference between simply seeing where your money is going and truly understanding why costs are increasing. Most vendor dashboards aren’t built for cloud cost optimization; they’re just tracking tools. And when the full cost picture is missing, teams often rely on manual processes, which are time-consuming and prone to error.
A good cost-savings dashboard should do more than show numbers. It should provide real context across both public and private cloud environments, helping to drive smarter decisions. Without that, cloud cost management becomes a reactive rather than a proactive approach.
7 Key Metrics That Matter for Cloud Cost Optimization
A cloud dashboard should do more than just display numbers. It should help you understand where your cloud budget is going and what you can do about it. For that, you need to track the right metrics, ones that highlight inefficiencies, uncover hidden costs, and support better decisions.
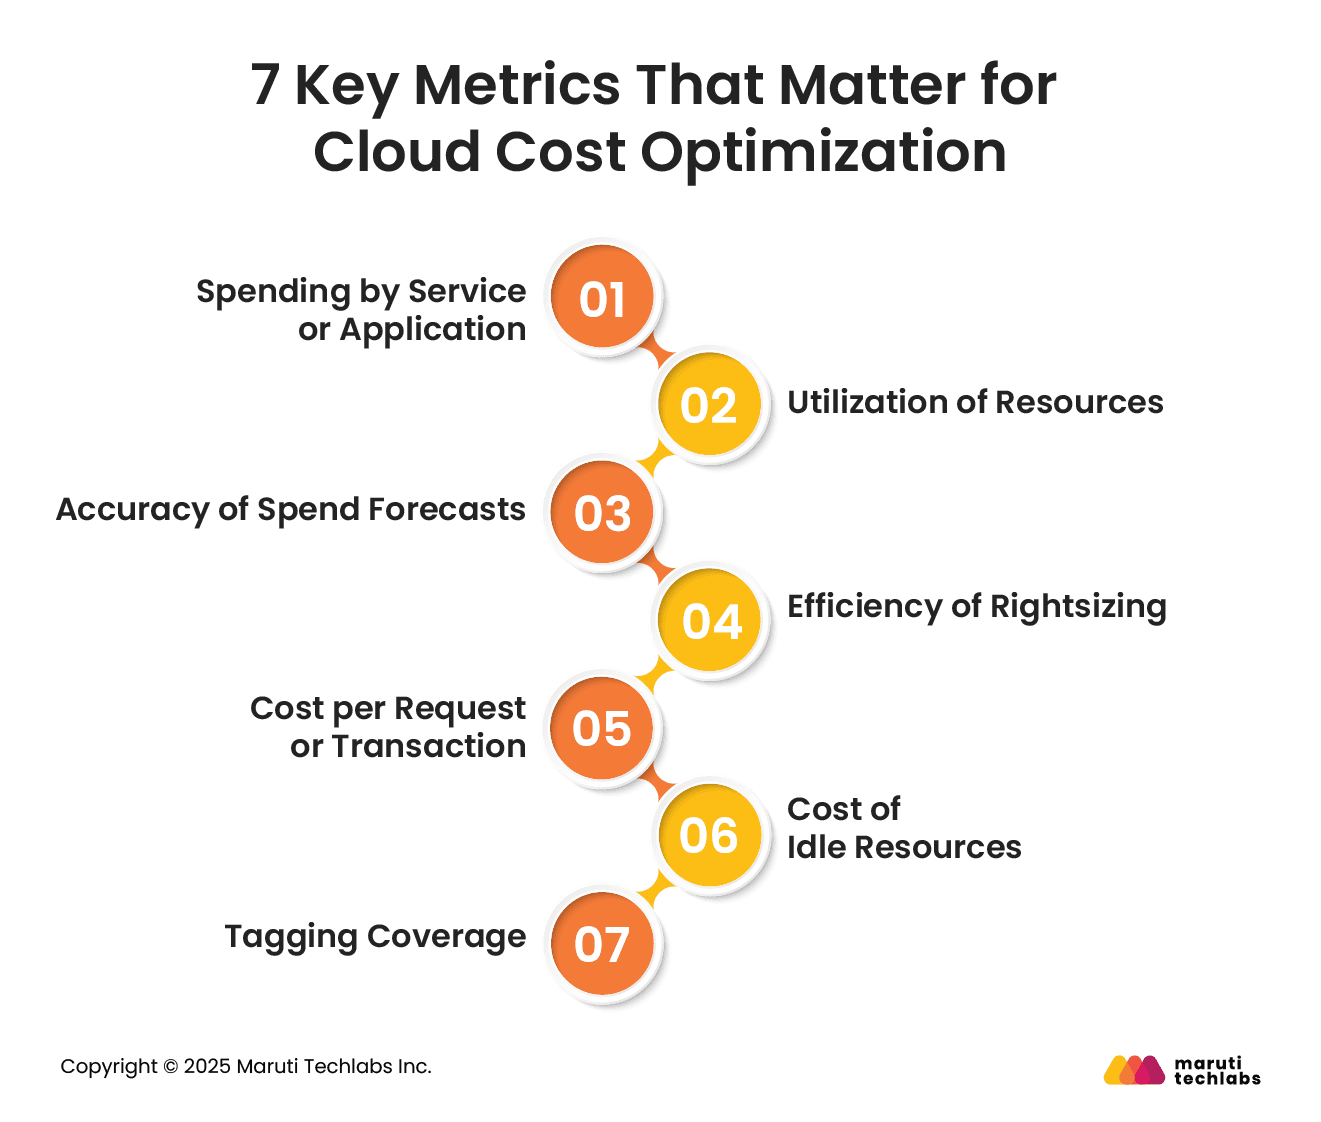
Below are seven key metrics that can make your cost savings dashboard genuinely useful for everyday cloud cost management and long-term cloud cost optimization:
1. Spending by Service or Application
You might think you know what’s driving your cloud costs, but it’s often something unexpected. A background task or internal tool can quietly accumulate over time. Breaking down your spending by application, team, or feature helps you see exactly where your budget is going and spot areas where you can cut back without affecting performance.
2. Utilization of Resources
This indicates how much of your cloud infrastructure is being utilized. Unused computing, storage, or memory still costs money. Identifying and optimizing these underutilized resources is crucial to effective cloud cost management.
3. Accuracy of Spend Forecasts
Are your monthly cloud bills close to what you expected? This metric helps build trust across teams and reduces budget surprises. If forecasts are consistently inaccurate, it's a sign to investigate and make adjustments.
4. Efficiency of Rightsizing
Buying too much "just in case" capacity leads to waste. This metric assesses how well your resources align with actual demand. It's crucial for cloud cost optimization.
5. Cost per Request or Transaction
How much are you spending to serve each customer action? Whether it's an API call or a checkout, this metric connects cloud cost to business value and flags when "savings" harm performance.
6. Cost of Idle Resources
Leftover test environments, unused volumes, or paused containers can still incur costs. This metric helps you identify and remove what's no longer needed.
7. Tagging Coverage
Accurate tagging is the foundation of a useful cloud dashboard. It lets you break down costs by team, app, or environment, and without it, every other metric becomes less reliable.
Design Principles for an Effective Cloud Cost Dashboard
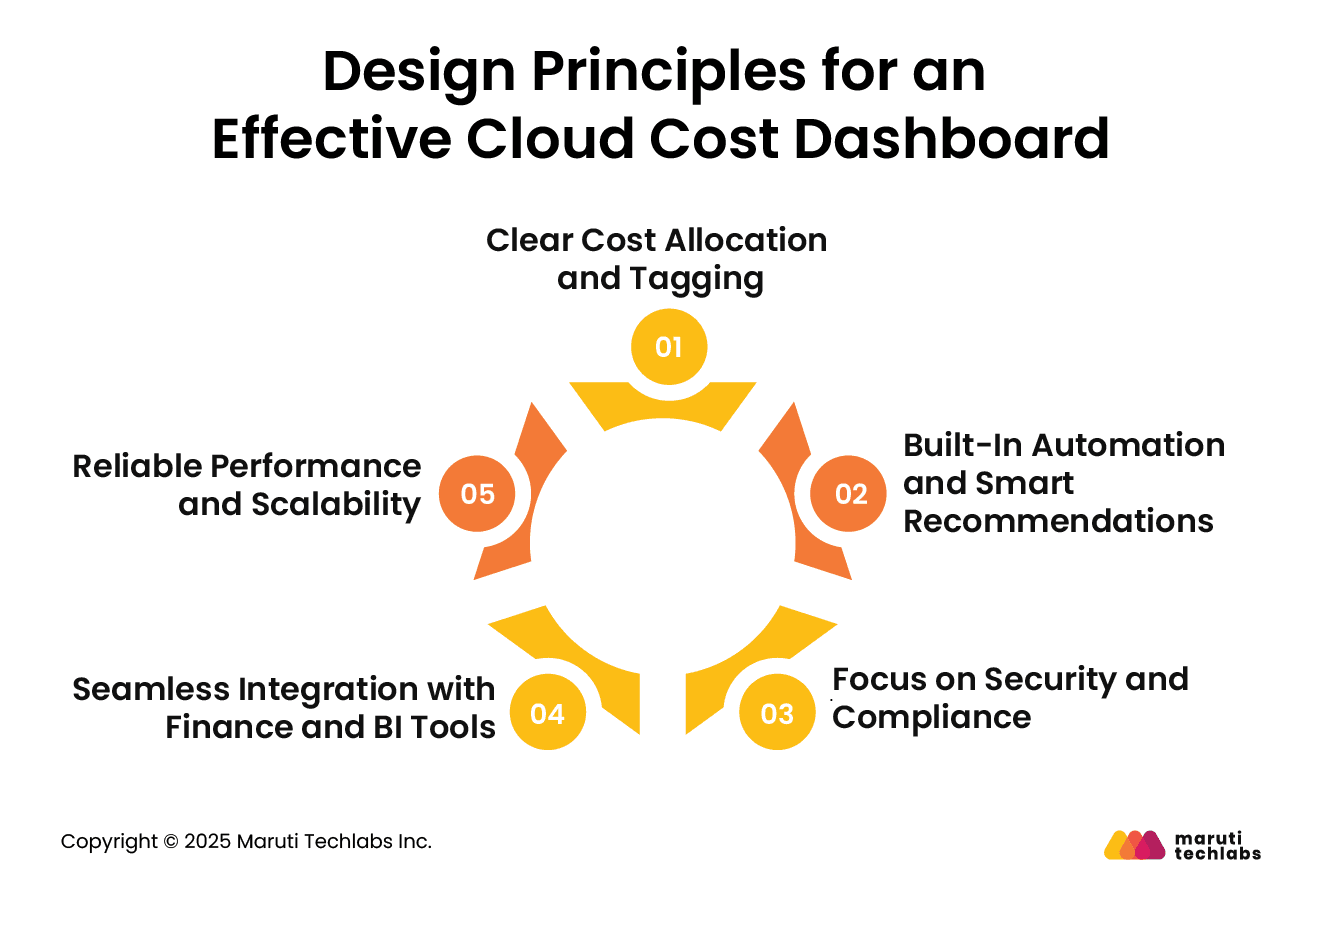
A cloud cost dashboard is most effective when it’s built on strong design principles that help teams understand, control, and act on cloud spending. Below are five key principles to consider when designing a dashboard that supports long-term cloud cost management and optimization.
1. Clear Cost Allocation and Tagging
A solid tagging and cost allocation system is the foundation of any useful dashboard. Every cloud resource should be tagged with details like team name, environment, project, or application. This helps break down cloud costs accurately and shows who is spending what.
Set clear tagging rules, make some tags mandatory, and review them regularly. The dashboard should also highlight untagged or incorrectly tagged resources, ensuring that nothing slips through the cracks. For shared services, build in mechanisms to allocate costs fairly across teams or departments.
2. Built-In Automation and Smart Recommendations
A strong cost-savings dashboard should go beyond reporting. It should help you take action automatically. For example, it can suggest when to switch to reserved instances, use spot instances, or downsize resources. Set up alerts for unusual spending or when you're nearing your budget limits.
You can also automate reports and enforce rules, such as shutting down non-production environments during nights or weekends.
3. Focus on Security and Compliance
Security can’t be an afterthought. Your dashboard should adhere to internal policies and any relevant industry regulations regarding data protection. This includes setting role-based access controls, keeping detailed logs, and encrypting cost data. Ensure you regularly update the system and review it for vulnerabilities. Additionally, the dashboard should facilitate the display of compliance efforts during audits.
4. Seamless Integration with Finance and BI Tools
To support better financial planning, your cloud cost dashboard should integrate seamlessly with existing tools, such as budgeting systems, ERP platforms, or business intelligence tools. Enable easy data sharing through exports, APIs, or automated syncs. This ensures cost data becomes part of larger financial decisions, not just a separate report.
5. Reliable Performance and Scalability
A slow or glitchy dashboard defeats the purpose. Monitor how the dashboard performs, examining data load times, user access, and system availability. Utilize caching and intelligent data grouping to maintain speed even as usage increases. Test regularly and fix slow spots before they affect users.
What 5 Tools You Need to Build a Cloud Cost Optimization Dashboard
To build a useful cloud cost dashboard, the right tools make all the difference. Here are five that help you track, analyze, and optimize your cloud spending with ease:
If you’re using AWS, Cost Explorer is a built-in tool that helps you understand your usage and spending. It shows detailed charts and reports, making it easier to see where your money is going. It also integrates with other AWS tools to provide more precise data, down to the level of each resource.
For GCP users, this tool offers a clear breakdown of costs by service, region, and project. You can identify unusual spikes, track trends, and even forecast future spending based on past usage patterns.
Finout lets you view cloud costs across providers such as AWS, GCP, Snowflake, and Kubernetes. It provides flexible dashboards and alerts, allowing you to monitor spending by team, app, or feature, all in one place.
CloudZero focuses on making cloud spending more straightforward to understand for both engineers and finance. It gives deep, business-level insights without relying on perfect tagging.
If you're running Kubernetes, Kubecost tracks your cluster costs in real-time. It also suggests ways to reduce waste and improve efficiency across deployments and services.
How Automation Improves Cloud Cost Management
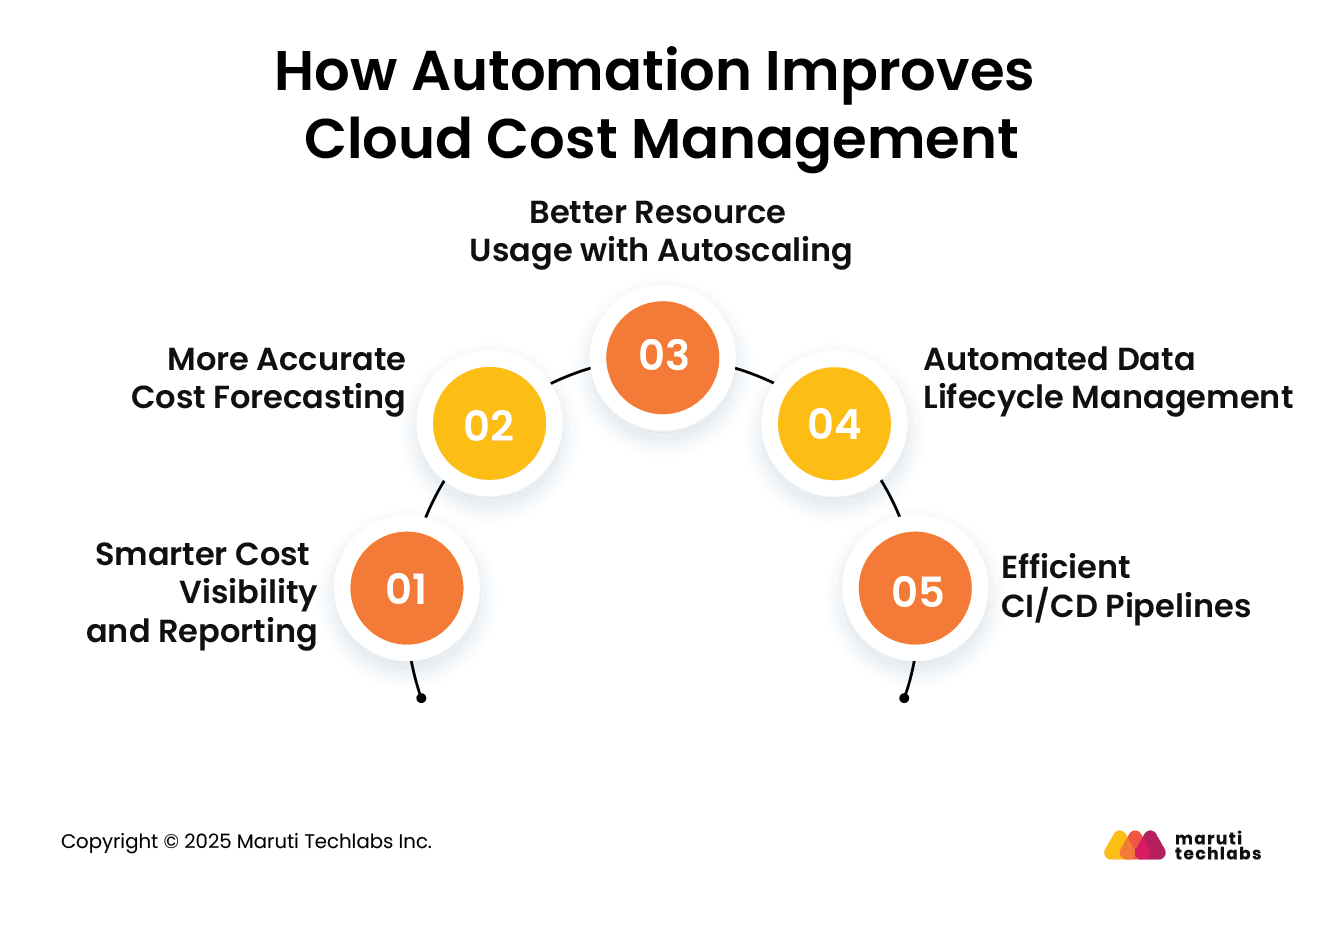
Automation plays a crucial role in enhancing cloud cost management. By reducing manual work and reacting to changes in real-time, automation helps teams make better decisions, avoid waste, and derive more value from their cloud spend. Here’s how:
1. Smarter Cost Visibility and Reporting
Automation tools can collect and analyze cost data across various cloud providers, providing a clear view of where your money is being spent. Instead of manually pulling data, automated dashboards and reports help track usage trends, identify unusual spending, and support more effective budgeting.
Tools like Google Cloud Monitoring even provide real-time views into resource usage.
2. More Accurate Cost Forecasting
When you have detailed data on how different services are used, you can make more accurate predictions about future costs. Automation helps break down cloud expenses by service or team, making it easier to plan budgets and avoid surprise bills.
3. Better Resource Usage with Autoscaling
Autoscaling helps your cloud setup adjust itself based on real-time needs. When more people are using your app, it adds resources to handle the extra load. When things quiet down, it scales things back. You don’t have to manage this manually. It keeps your system running well during busy times and saves money when demand is low, so you’re only paying for what you use.
4. Automated Data Lifecycle Management
Old or unused data can quietly increase storage costs. Automation tools can archive or delete data based on policies you define, so you’re not paying to store things you no longer need. This helps keep storage spending under control.
5. Efficient CI/CD Pipelines
Automated CI/CD pipelines streamline the process of building, testing, and deploying software. This reduces manual errors, speeds up releases, and helps teams stay focused on improving applications instead of fixing broken processes.
Why Embedding FinOps Into Dev Workflows Supports Cost Savings
As cloud spending continues to grow, managing costs efficiently has become just as important as building and deploying software quickly. That’s where FinOps comes in. However, to make it truly effective, FinOps needs to be integrated into how development teams work every day, not just a separate financial process.
Bringing FinOps into DevOps workflows means encouraging collaboration between engineering, operations, and finance. When every team is responsible for cloud spending, they naturally start making smarter choices, such as selecting the right resources, monitoring usage, and automating where possible.
With shared visibility and common goals, teams can avoid waste and make smarter choices that support both performance and budget.
This shift isn’t just about tools; it also requires a cultural change. Developers and other stakeholders must understand how their actions affect cloud costs. That’s why training and ongoing support are necessary. Helping teams build cost awareness into their daily work leads to better accountability, especially when budgets and chargebacks are involved.
When FinOps becomes a shared mindset across teams, not just a finance task, it creates a foundation for long-term cloud cost optimization and better financial decisions throughout the development lifecycle.
Conclusion
A cloud cost dashboard isn’t just about showing numbers. It should help you make better decisions for your business. Building your dashboard gives you more control and flexibility, but it takes time, effort, and the right people. Choosing a ready-made tool or working with an expert can be faster, easier to set up, and can help you start saving money sooner.
At the end of the day, the best choice depends on your team’s goals, skills, and how quickly you need results.
If you're unsure where to begin, we're here to support you. At Maruti Techlabs, we work closely with businesses to create cloud solutions that actually fit their needs—simple to manage, built to grow, and focused on keeping costs under control. Whether you're starting fresh with a custom cloud cost dashboard or looking to improve what you already have, our team is here to help.
Need to protect what you build? Alongside optimization, we offer comprehensive Cloud Security Services that help you safeguard your infrastructure, ensure compliance, and stay ahead of evolving threats—without adding complexity.
Curious about how much you could save? Try our Cloud Migration Cost Calculator to estimate your potential cloud optimization and migration savings.
FAQs
1. How do I access my cloud dashboard?
You can access your cloud dashboard by logging into your cloud provider’s console, like AWS, Google Cloud, or Azure. Once logged in, go to the billing or monitoring section. There, you’ll find your usage, costs, and other key data shown in charts and reports. You can also utilize third-party tools that integrate with your cloud account, allowing you to view everything in one place.
2. What is an iCloud dashboard?
An iCloud dashboard usually refers to the main screen or area where you manage your iCloud services. On Apple devices, you can go to Settings > [your name] > iCloud to see what’s being used—like storage, backups, photos, and more. On a computer, you can visit iCloud.com and log in to access your files, photos, mail, and other iCloud features in one place.
3. What are the four types of dashboards?
Dashboards usually fall into four types:
Operational – shows real-time data for day-to-day tasks
Strategic – gives high-level views for long-term goals
Analytical – helps explore trends and patterns in detail
Tactical – focuses on short-term goals and performance
Each type is used for different business needs, depending on who’s using it and what they want to track.
4. Which tool is best for cloud dashboards?
The best tool depends on your needs and cloud setup. For AWS users, Cost Explorer works well. For multi-cloud setups, tools like CloudZero, Finout, or Kubecost give detailed views and cost insights. If you need a custom view tailored to your business, building a dashboard with the help of a cloud expert may be the best choice.
About the author
Mitul Makadia
Mitul is the Founder and CEO of Maruti Techlabs. From developing business strategies for our clients to building teams and ensuring teamwork at every level, he runs the show quite effortlessly.
Stuck with a Tech Hurdle?
We fix, build, and optimize. The first consultation is on us!