

Application Reliability in Production Environments: Frameworks, Tools, and Best Practices
Key Takeaways
- Performance, recovery speed, and failure prediction are all aspects of reliability that go beyond uptime.
- Architecture patterns such as circuit breakers and failover define how systems behave under stress.
- Production release risk is reduced by deployment techniques such as canary and blue-green.
- AIOps improves signal quality and accelerates incident response in complex systems.
- Measurable dependability is based on observability and SLOs.
- Maintaining dependability at scale requires testing for failure conditions.
Application reliability determines whether software continues to perform consistently under real-world conditions. Reliability should be a primary engineering concern rather than an operational afterthought in production, as even minor infrastructure failures might result in extensive outages.
On October 20, 2025, a race condition in DynamoDB's automated DNS management system deleted the DNS records for DynamoDB's regional endpoint in AWS's US-EAST-1 region. The failure spread well beyond AWS's own stack: EC2, Lambda, and dozens of dependent services went down, including platforms that only ran on AWS rather than integrating with it.
The lesson is clear: most production outages start outside your own code, so fault tolerance must be designed in, not bolted on. Building resilient production systems requires sound architecture, automated operations, and continuous monitoring, which is why many organizations invest in DevOps Consulting Services to strengthen reliability throughout the software lifecycle.
This guide explains the frameworks, tools, architecture patterns, deployment strategies, and testing practices that help engineering teams build reliable production systems and recover faster when failures occur.

What is a Production Environment? (And How It Differs from Dev & Staging)
| The production environment is your live business environment, where your internal and external users interact with applications and generate actual business data. |
It is important to distinguish among development, staging, and production from both operational and semantic standpoints. Code that passes every test in staging can still fail in production because staging rarely replicates production's traffic volume, data variability, and third-party dependency behavior at scale. The majority of "it worked on my machine" cases come from that gap.
The differences between production, development, and staging are displayed in the table below.
| Environment | Purpose | Users | Stability Required |
| Development | Write and unit-test code | Engineers only | Low, expected to break |
| Staging | Validate changes under production-like conditions | QA, engineers, occasionally stakeholders | Moderate, should mirror production closely |
| Production | Serve live users and transactions | End users, customers | High, every failure has a business cost |
Development Environment
Development environments are where engineers write and test code in isolation, typically on local machines or ephemeral cloud instances. Data is synthetic or scrubbed, infrastructure is minimal, and instability is expected. A broken dev environment costs an engineer minutes, not the business revenue.
Staging Environment
Staging exists to verify that an application will behave the same way in production. This is only possible when the staging environment closely matches production, including its infrastructure, data volume, third-party integrations, and network conditions, not just the codebase.
Teams that treat staging as a lightweight sandbox rather than a production mirror reinforce the wrong signals. A dataset with 10,000 rows will not expose query failures that emerge at scale. Missing load balancer parity hides session and concurrency issues. Without production alignment, staging tests lose credibility and become a checkbox rather than a real risk filter.
Production Environment
Production is where reliability is no longer optional. Every characteristic covered in the next section (availability, fault tolerance, performance under load, recoverability, security) exists because production is the only environment where failure directly translates to lost revenue, breached SLAs, or customer churn. Development and staging failures are inconvenient. Production failures are expensive.
What are the Key Characteristics of a Reliable Production Environment?
The purpose of a dependable production environment is to maintain applications' availability, resilience, and security in practical settings. In addition to preventing outages, it ensures that systems can handle traffic spikes, bounce back quickly from errors, and continue functioning without sacrificing security or compliance.
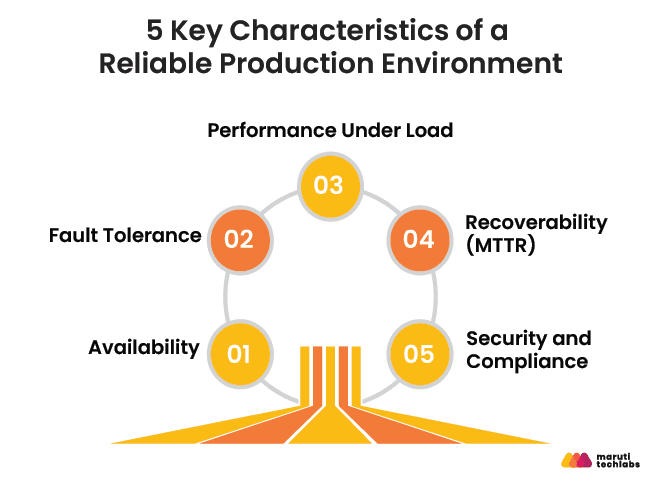
The following characteristics define the operational maturity of a production environment.
Availability
Availability is expressed as a percentage of uptime, commonly referred to as “the nines.”
| Availability | Downtime per Year | Downtime per Month |
| 99% (two nines) | 3.65 days | 7.3 hours |
| 99.9% (three nines) | 8.76 hours | 43.8 minutes |
| 99.99% (four nines) | 52.6 minutes | 4.4 minutes |
| 99.999% (five nines) | 5.3 minutes | 26 seconds |
Most B2B SaaS platforms operate between 99.9% and 99.95%. Higher targets demand disproportionate investment in redundancy, failover, and operational rigor. The trade-off is economic, not technical.
Availability is a direct revenue concern rather than a technical parameter, as enterprise research consistently shows that even one hour of interruption can have an impact exceeding $300,000.
Fault Tolerance
Fault tolerance determines whether failures stay localized or cascade across the system. It is enforced through redundancy, automated failover, and isolation patterns such as circuit breakers. The goal is not to eliminate failure but to prevent dependency-level issues from escalating into system-wide outages.
Performance Under Load
Reliability degrades silently under load before it fails visibly. It is necessary to assess latency, throughput, and error rates collectively, with a focus on tail latency (p95, p99). A significant portion of customers may nonetheless receive poor experiences from a system that reports acceptable averages. Ignoring tail activity causes production environments to misjudge the health of the system.
Recoverability (MTTR)
The pace at which a system returns to regular functioning after a failure is determined by Mean Time to Recovery. MTTR indicates how long failures affect the company, whereas availability indicates how often they occur. Strong monitoring and incident response procedures enable organizations to address problems more quickly, minimizing downtime and commercial damage.
Security and Compliance
Reliability includes system integrity. A platform that is available but compromised, or that fails to meet compliance requirements, cannot be considered reliable. This is especially critical in regulated environments.
The baseline consists of encryption, access control, and auditability. What sets them apart is the extent to which these restrictions are incorporated into runtime activities, rather than viewed as external layers.
Failure is not completely eliminated by a manufacturing environment that consistently operates across all of these aspects. It guarantees that failures are economically manageable, predictable, and controlled.
Site Reliability Engineering (SRE): The Framework Behind Production Reliability
Site Reliability Engineering is the discipline Google created to apply software engineering practices to operations, treating reliability as an engineering problem with measurable targets rather than a best-effort operational task.
The core shift: instead of aiming for perfect uptime, SRE teams define how much unreliability is acceptable and engineer to that number, freeing the team to ship faster within a defined risk budget.
SLI, SLO, and SLA: What's the Difference?
| Term | Definition | Who Sees It |
| SLI (Service Level Indicator) | The actual measured metric, e.g., request latency or error rate | Internal engineering |
| SLO (Service Level Objective) | The internal target for that metric, e.g., 99.9% of requests under 300ms | Internal engineering, leadership |
| SLA (Service Level Agreement) | The external, contractual commitment to customers, usually looser than the SLO | Customers, legal, sales |
The SLO should always be stricter than the SLA. That buffer is what allows a team to occasionally miss its internal target without breaching a customer contract.
Error Budgets: A Worked Example
An error budget is the inverse of your SLO: the amount of unreliability you're allowed to spend before you've broken your promise. At a 99.9% SLO, the monthly budget is 43.8 minutes of downtime or degraded service.
In this way, a passive metric becomes a tool for making decisions. By the third week of the month, a team should halt hazardous deployments and give stability work priority over new features if they have burned 40 of their 43.8 minutes.
Observability vs. Monitoring: The Three Pillars of Production Visibility
Monitoring alerts you when anything has broken that you anticipated. Observability lets you ask new questions about failures you didn't anticipate, without shipping new code to answer them. Monitoring is built on predefined dashboards and alerts. Observability is built on rich, queryable data (logs, metrics, and traces) that lets engineers investigate the unknown unknowns.
The distinction is important not only technically but also commercially. The checkout service is down, according to a monitoring-only stack. An observability stack reduces root cause time from hours to minutes by alerting you when a specific database connection pool is depleted after a traffic surge from a single customer's integration.
Logs
Logs are timestamped, discrete records of events, the raw detail needed to reconstruct exactly what happened during an incident. Common tools: ELK Stack, Grafana Loki, Splunk.
Metrics
Metrics are numerical measurements that are aggregated over time, like CPU utilization or request count, and are intended to effectively track trends and send out alerts at scale. Prometheus, Datadog, and CloudWatch are common tools.
Traces
Traces track a single request as it passes across services, revealing the precise location of time spent in a distributed system. This is what makes microservices debuggable when a slow response could originate in any one of a dozen services. Common tools include AWS X-Ray, Zipkin, and Jaeger.
| Pillar | What It Answers | Best Tools |
| Logs | What exactly happened, and when | ELK Stack, Grafana Loki, Splunk |
| Metrics | How is the system trending, and should we alert | Prometheus, Datadog, CloudWatch |
| Traces | Where is time being lost across services | Jaeger, Zipkin, AWS X-Ray |
No single pillar is sufficient alone. Metrics tell you something is wrong, traces tell you where, and logs tell you why. Teams that only invest in one end up with faster alerts but the same slow root-cause process they had before.
What Is AIOps, and How Does Agentic Incident Response Work?
AIOps applies machine learning and agentic AI across logs, metrics, traces, and events to improve incident detection and resolution. It correlates signals across the stack, identifies probable root causes, and can trigger predefined remediation. The model shifts from isolated monitoring tools to system-level reasoning.
How AIOps Differs from Traditional Monitoring
Conventional platforms for monitoring and observability reveal what is already flawed. They rely on manual triage, dashboards, and thresholds. High alarm noise and slow correlation across dispersed systems are the two structural restrictions that result from this.
AIOps introduces context-aware analysis to handle both. It prioritizes concerns according to their impact, eliminates redundant alerts, and combines related signals into single events.
Current State of Agentic Operations
Two cloud-native agentic operations products reached general availability within weeks of each other in 2026, alongside longer-standing AIOps features from Datadog and Dynatrace:
| Tool | Category | What It Does |
| AWS DevOps Agent | Agentic, GA March 31, 2026 | Autonomously investigates incidents across AWS, Azure, and on-prem environments, correlating telemetry, code, and deployment data (AWS, GA announcement) |
| Azure SRE Agent | Agentic, GA March 2026 | Operates with deep context of source code, logs, metrics, and traces, and can recommend, investigate, or execute actions based on governance controls (Microsoft, GA announcement) |
| Datadog Watchdog | Detection and correlation | Unsupervised ML anomaly detection across metrics and logs, with alert correlation to reduce noise; flags issues and surfaces likely causes but is built around human-led investigation rather than autonomous action |
| Dynatrace Davis AI | Detection, correlation, and root cause | Continuously models dependencies across the environment to automatically identify root cause, with auto-remediation available for predefined, known-issue playbooks |
Real Impact: What's Actually Verified
The vendor-published numbers here are strong, but they come from vendors, so treat them as a starting point for your own pilot, not a guarantee.
AWS reports that customers in preview saw up to 75% lower MTTR, 80% faster investigations, and 94% root cause accuracy. (AWS, GA announcement) In a named customer case, Western Governors University's SRE team used AWS DevOps Agent to cut incident resolution from an estimated two hours to 28 minutes, a 77% MTTR improvement, on a production Lambda configuration issue.
Microsoft claims that by using the SRE Agent internally across all of its Azure services, more than 35,000 incidents have been resolved and more than 20,000 engineering hours have been saved. A named early adopter, Ecolab, reduced daily performance alerts from 30 to 40 down to under 10 after adopting the agent.
Measurable Impact on Operations
Operational efficiency at scale is the main benefit of AIOps. By combining duplicate signals into a smaller set of actionable situations, Watchdog can drastically reduce alert noise, according to Datadog. Dynatrace positions Davis as enabling faster root cause identification by automatically analyzing service dependencies and anomalies in real time.
The consistent impact areas are evident across platforms:
- Lowering the alarm volume and raising the signal-to-noise ratio
- Automated correlation for quicker issue triage
- Mid-severity occurrences have a lower mean time to recovery
- Less cognitive strain on engineering teams in stressful situations
These gains are most visible in complex, distributed systems where manual correlation is no longer viable.
Where Human Oversight Remains Critical
Despite advances in agentic capabilities, fully autonomous remediation is not a default operating model. Production systems involve trade-offs that require contextual judgment, especially in high-risk scenarios.
Human oversight remains essential in:
- Verifying corrective measures that affect user experience or data integrity
- Managing edge scenarios if there is insufficient or deceptive training data
- Handling cross-system dependencies that go beyond what can be seen
- Establishing rollback plans, escalation routes, and guardrails
AIOps systems are most effective when positioned as augmentation layers, not replacements. They compress detection and diagnosis time, but final accountability for system behavior remains with engineering teams.
Organizations that integrate AIOps with clear operational boundaries see the strongest results. The goal is not full automation, but controlled acceleration of incident response without compromising system stability.
What are the Core Architecture Patterns for Application Reliability?
Applications are kept accessible, scalable, and robust in the face of failures and varying workloads thanks to core architecture patterns for application reliability. Techniques such as load balancing, auto-scaling, redundancy, and database resilience work together to distribute traffic, isolate failures, enable quick recovery, and maintain consistent performance in production environments.
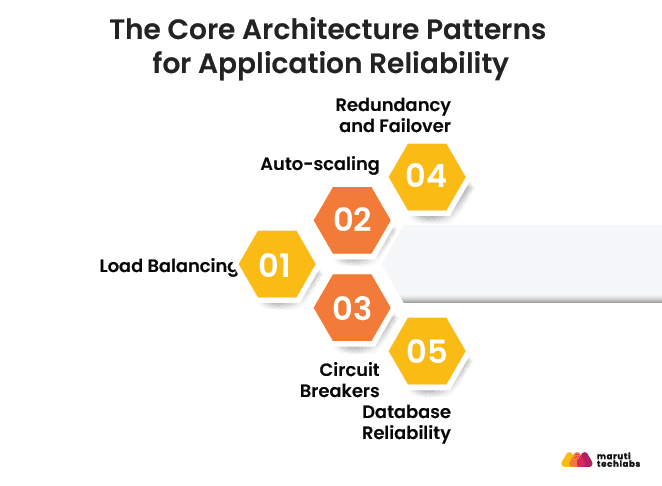
Load Balancing
Load balancing distributes incoming traffic across multiple instances to prevent overload and improve availability. Tools such as AWS Application Load Balancer, NGINX, and HAProxy route requests based on health checks and traffic rules. Health checks ensure only healthy instances receive traffic, while sticky sessions are used selectively when session persistence is required.
Auto-scaling
Auto-scaling ensures systems adapt to demand in real time. Horizontal scaling adds or removes instances, while vertical scaling increases resource capacity on existing nodes. AWS Auto Scaling Groups and Kubernetes Horizontal Pod Autoscaler enable dynamic scaling based on metrics such as CPU, memory, or request volume. Horizontal scaling is generally preferred for resilience and fault isolation.
Circuit Breakers
Circuit breakers prevent cascading failures by stopping calls to unhealthy services. When failure thresholds are exceeded, requests are short-circuited, allowing dependent systems to degrade gracefully rather than fail completely. Libraries such as Hystrix and Resilience4j implement this pattern effectively in distributed systems.
Redundancy and Failover
Redundancy ensures system availability when components fail. Active-active setups distribute traffic across multiple nodes simultaneously, while active-passive configurations rely on standby systems that take over in the event of a failure.
Multi-availability zone deployments reduce infrastructure risk. Recovery Time Objective (RTO) and Recovery Point Objective (RPO) define acceptable downtime and data loss, respectively, and guide failover design.
Database Reliability
Database reliability focuses on maintaining performance and data integrity under load. Connection pooling optimizes resource usage, read replicas distribute query load, and automated backups ensure recoverability. These mechanisms reduce bottlenecks and protect against data loss during failures.
These patterns work together to ensure failures are isolated, traffic is managed efficiently, and systems recover without service-wide disruption.
How Do You Deploy to Production With Zero Downtime?
Zero-downtime releases depend on how risk is introduced and controlled during deployment. The goal is to validate changes in production conditions without exposing the entire user base to failure. Three strategies dominate modern production environments.
Blue-Green Deployment
These systems lessen bottlenecks and guard against data loss in the event of a malfunction. Before traffic is shifted, new releases are pushed to the idle environment and verified. Traffic shifting and rollback are automated by programs like Spinnaker and AWS CodeDeploy.
By returning traffic to the prior environment, this method provides almost instantaneous rollback. Higher infrastructure costs as a result of redundant environments are the trade-off.
Canary Deployment
Canary deployment releases changes to a small subset of users before full rollout. It is typically combined with feature flags to control exposure at a granular level. System behavior is monitored closely, and rollout is expanded only if metrics remain stable.
This strategy minimizes blast radius and enables real-world validation, making it suitable for high-risk or high-impact changes.
Rolling Deployment
Rolling deployment gradually replaces outdated instance versions with fresh ones. This is natively supported by Kubernetes through health checks and controlled pod updates.
It keeps infrastructure costs down and eliminates the need for redundant environments. However, incomplete deployment states need to be carefully managed, and rollbacks are slower than blue-green deployments.
Strategy Comparison
| Strategy | Downtime Risk | Rollback Speed | Infra Cost | Best For |
| Blue-Green | Very Low | Instant | High | Critical systems requiring fast rollback |
| Canary | Low | Fast (controlled rollback) | Medium | High-risk changes needing validation |
| Rolling | Moderate | Slower | Low | Continuous delivery with cost constraints |
The right strategy depends on system criticality, risk tolerance, and infrastructure maturity. High-reliability environments often combine these approaches with observability and automated rollback triggers to enforce release safety.
What Are the Best Practices for Application Reliability in Production?
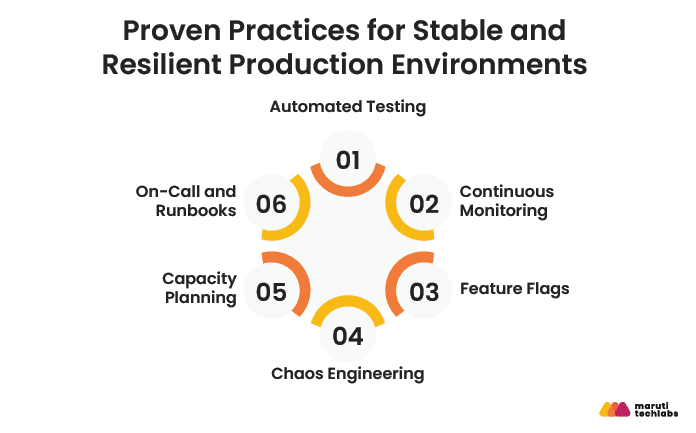
Application reliability in production is achieved through proactive testing, continuous observability, controlled releases, and structured incident management. These practices reduce deployment risk, improve fault detection, and ensure systems recover quickly from failures.
Automated Testing
The first line of defense against production failure is automated testing. With an emphasis on regression testing, contract testing, and failure scenarios, high-performing teams automate throughout the unit, integration, API, and end-to-end levels. Automated checks are also used to validate infrastructure and deployment pipelines.
The objective is not coverage as a vanity metric, but early detection of breaking changes before they reach production. Mature setups extend testing into production through synthetic checks and post-deployment validation.
Continuous Monitoring
Continuous monitoring ensures real-time visibility into system behavior across infrastructure and application layers. This includes metrics, logs, and distributed traces, correlated into a unified view.
Actionable signals are given priority over dashboards in effective monitoring, and alerts are linked to service-level goals rather than arbitrary criteria. Early anomaly detection, lowering alert fatigue, and facilitating quicker root cause identification during incidents are the main goals.
Feature Flags
Feature flags decouple deployment from release, allowing teams to control feature exposure without redeploying code. Platforms such as LaunchDarkly, Flagsmith, and AWS AppConfig enable gradual rollouts, A/B testing, and instant rollback of problematic features. This reduces deployment risk and supports safer experimentation in production environments.
Chaos Engineering
Chaos engineering validates system resilience by intentionally injecting failures. Tools like Chaos Monkey, Gremlin, and AWS Fault Injection Simulator simulate real-world disruptions such as instance failures, latency spikes, and network issues. This exposes hidden weaknesses in failover mechanisms and recovery processes, ensuring systems behave predictably under stress.
Capacity Planning
Capacity planning ensures systems handle growth without performance degradation. Tools such as k6 and Locust are used to baseline system performance under realistic load conditions. This helps define scaling thresholds, identify bottlenecks, and validate auto-scaling behavior before traffic spikes occur.
On-Call and Runbooks
Well-defined on-call processes and runbooks improve the consistency and speed of incident response. Clear playbooks, escalation paths, and predefined recovery steps reduce ambiguity during outages and enable teams to resolve issues with minimal delay.
The focus is on repeatability and clarity under pressure. Implementing these practices as a system helps reduce both the frequency of failures and the cost of recovery.
Common Production Reliability Challenges (and How to Solve Them)
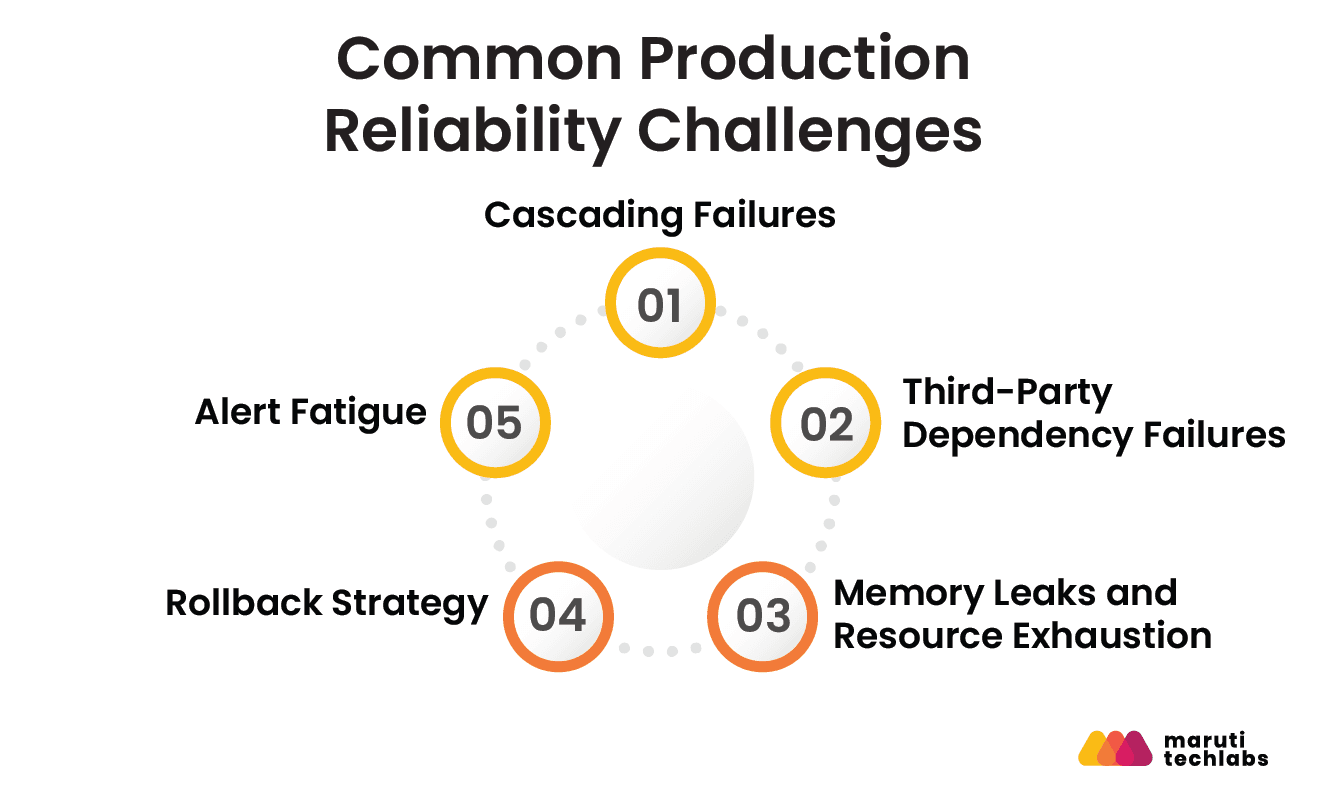
Production failures emerge from predictable patterns in distributed systems. Addressing these patterns requires architectural controls and operational discipline.
Cascading Failures
Cascading failures occur when one failing service propagates instability across dependent systems. Without isolation, a single point of failure can trigger system-wide outages. Circuit breakers, bulkheads, and timeouts prevent this by limiting the spread of failures and ensuring services degrade gracefully rather than collapsing.
Third-Party Dependency Failures
External dependencies introduce failure modes outside direct control. Payment gateways, APIs, and SaaS integrations can degrade or become unavailable without warning. Resilience depends on fallback mechanisms, response caching, and continuous SLA monitoring. Systems should be designed to operate in a degraded mode rather than fail completely when dependencies break.
Memory Leaks and Resource Exhaustion
Uncontrolled memory growth and resource leaks lead to gradual performance degradation followed by failure. These issues are often silent until they reach critical thresholds. Application Performance Monitoring tools, heap profiling, and automated restarts help detect and mitigate such conditions before they impact users.
Rollback Strategy
Failed deployments without a clear rollback path extend downtime and increase risk. Reliable systems define explicit rollback triggers based on metrics and error thresholds. These rollbacks are automated within CI/CD pipelines to ensure rapid reversal without manual intervention.
Alert Fatigue
Excessive or poorly tuned alerts reduce response effectiveness. When every signal is treated as critical, important incidents are missed. Alert grouping and intelligent routing through platforms like PagerDuty and OpsGenie consolidate related alerts into actionable incidents, improving signal quality and response time.
These challenges are recurring, not exceptional. Systems that anticipate them and embed the right controls maintain stability even under failure conditions.
Incident Response: Detecting, Resolving, and Learning from Production Failures
Reliability is ultimately measured by how effectively teams respond when systems fail. Strong incident response reduces downtime, limits user impact, and turns failures into structured learning.
Incident Detection
Detection defines how quickly a team becomes aware of an issue. Effective setups combine SLO-based alerting with well-calibrated thresholds to avoid noise while ensuring critical signals are not missed. On-call rotations ensure ownership and immediate response, with escalation paths for high-severity incidents. The objective is early, accurate detection without overwhelming responders.
Incident Response Playbook
A consistent response model reduces chaos during incidents. High-performing teams follow a structured flow:
- Detect: Identify anomalies through alerts or monitoring signals
- Acknowledge: Assign ownership and initiate response
- Triage: Assess severity, scope, and potential impact
- Remediate: Apply fixes, failover, or rollback actions
- Communicate: Provide timely updates to stakeholders and users
This structure ensures parallel execution of technical resolution and stakeholder communication, reducing both downtime and uncertainty.
Blameless Post-Mortems
Post-incident analysis is where reliability compounds over time. Blameless post-mortems, formalized in the Google SRE framework, focus on identifying systemic gaps rather than individual mistakes.
They document root cause, contributing factors, and corrective actions, creating a feedback loop that strengthens future incident response and system design.
Recovery speed and long-term stability are enhanced in organizations that approach incident response as a continuous system. Structured managed services and quality engineering techniques offer the basis for constant, production-grade dependability for teams seeking to operationalize this rigor.
Which Are the Best Application Reliability Tools for Production in 2026?
The best application reliability tools for production in 2026 span observability, logging, infrastructure, incident management, chaos engineering, and load testing. The design of your application, operational complexity, and the degree of automation and visibility your team needs will determine the best combination.
Monitoring and APM
- Datadog: Strong for cloud-native environments with unified metrics, logs, and traces. Best suited for teams that need fast setup and broad integrations.
- New Relic: A flexible, developer-friendly platform with end-to-end observability across application layers. Works well for teams prioritizing cost control and customization.
- Dynatrace: Focused on enterprise-scale environments with deep dependency mapping and AI-driven root cause analysis. Ideal for complex, distributed architectures.
Logging
- ELK Stack (Elasticsearch, Logstash, Kibana): Highly customizable and widely adopted for centralized logging, but requires operational overhead.
- Grafana Loki: Cost-efficient log aggregation designed for Kubernetes-heavy environments, optimized for label-based querying.
- Splunk: Enterprise-grade logging with advanced analytics and search capabilities, suited for large organizations with compliance requirements.
Infrastructure and Orchestration
- Docker: Standard for containerization, enabling consistent environments across development and production.
- Kubernetes: Orchestrates containers at scale with built-in support for scaling, self-healing, and rolling deployments.
- AWS ECS: Managed container orchestration with lower operational overhead than Kubernetes, suitable for teams prioritizing ease of use.
Alerting and On-Call
- PagerDuty: Mature incident management platform with advanced alert routing, escalation policies, and integrations.
- OpsGenie: Strong alerting and on-call scheduling with flexible routing rules, often used in mid-to-large teams.
- VictorOps: Designed for real-time incident collaboration, with emphasis on team communication during outages.
Chaos Engineering
- Gremlin: Enterprise-ready chaos engineering platform with controlled failure injection and safety mechanisms.
- AWS Fault Injection Simulator (FIS): A native AWS service for testing failure scenarios in cloud environments.
- Chaos Monkey: An early-stage chaos tool that randomly terminates instances, useful for basic resilience testing.
Load Testing
- k6: Developer-centric load testing tool with scripting support and strong CI/CD integration.
- Locust: Python-based framework for flexible, distributed load testing.
- JMeter: A mature tool with extensive protocol support, widely used in enterprise performance testing.
Tool Comparison
| Tool Category | Tool | Best For | Free Tier? |
| Monitoring & APM | Datadog | Cloud-native observability with fast setup | Limited |
| Monitoring & APM | New Relic | Flexible, developer-focused observability | Yes |
| Monitoring & APM | Dynatrace | Enterprise-scale, AI-driven monitoring | No |
| Logging | ELK Stack | Customizable centralized logging | Yes (self-managed) |
| Logging | Grafana Loki | Kubernetes-native log aggregation | Yes |
| Logging | Splunk | Enterprise logging and analytics | Limited |
| Infrastructure | Docker | Containerization | Yes |
| Infrastructure | Kubernetes | Container orchestration at scale | Yes |
| Infrastructure | AWS ECS | Managed container orchestration | No |
| Alerting | PagerDuty | Incident management and escalation | Limited |
| Alerting | OpsGenie | Alert routing and on-call scheduling | Limited |
| Alerting | VictorOps | Real-time incident collaboration | Limited |
| Chaos Engineering | Gremlin | Controlled failure injection | No |
| Chaos Engineering | AWS FIS | AWS-native chaos testing | No |
| Chaos Engineering | Chaos Monkey | Basic resilience testing | Yes |
| Load Testing | Locust | Python-based distributed testing | Yes |
| Load Testing | JMeter | Enterprise protocol testing | Yes |
The right stack depends on system complexity, team maturity, and cloud strategy. High-performing teams optimize for integration and signal quality rather than tool proliferation.
Which Testing Approaches Best Support Production Reliability?
Production reliability depends on how systems are validated under real-world conditions. These strategies focus on exposing failure modes before they impact users, and ensuring systems behave predictably under stress.
User Acceptance Testing (UAT)
UAT validates whether the system meets business requirements in conditions that closely resemble production. Unlike functional testing, this approach focuses on end-to-end workflows, data integrity, and user-critical paths. Mature teams execute UAT in production-like environments with realistic data sets and traffic patterns.
This reduces the gap between staging validation and real-world behavior, ensuring that releases meet both technical and business expectations before exposure.
Load Testing
Load testing defines how systems perform under expected and extreme traffic conditions. It is not limited to identifying breaking points but also to establishing clear pass-or-fail thresholds. For example, maintaining p95 latency below 500ms at 10x expected traffic provides a measurable reliability benchmark.
Tools such as k6 and Locust are used to simulate realistic traffic patterns, validate scaling behavior, and identify bottlenecks before they surface in production.
Synthetic Monitoring
Synthetic monitoring continuously tests critical user journeys from outside the system, simulating real user behavior. Tools like Datadog Synthetics, Checkly, and Pingdom execute scheduled checks across endpoints and workflows. This ensures early detection of availability or performance issues, even before users report them. It also provides a consistent baseline for uptime and latency across regions.
Chaos Testing
To verify system resilience, chaos testing deliberately introduces controlled failures. By concentrating on particular failure situations like service failures, delay injection, or infrastructure disturbance, it enhances more general chaos engineering techniques. Chaos testing ensures that detection, failover, and recovery techniques function as intended in real-world failure scenarios when combined with incident response and AIOps systems.
These strategies close the gap between pre-production validation and production reality. Systems tested for failure, not just functionality, sustain reliability at scale and through change.
Conclusion
Every pattern in this guide (SLOs, circuit breakers, observability, chaos testing) exists to answer one question before an outage does: how much can this system take before it breaks, and how fast can it recover when it does? The teams that answer that question in advance are the ones whose incidents stay minor.
You don't need every pattern in this guide on day one. You need to know which ones your system is missing right now, and fix those first.
FAQs
1. Why is application reliability so crucial for my business?
Churn, failed SLAs, and lost transactions are all direct costs of unreliable software. Reliability should be included in engineering planning, not just operations, because it safeguards revenue and confidence.
2. What is the difference between application reliability and availability?
Availability is a subset of reliability. It measures uptime, typically expressed as percentages such as 99.9% or 99.99%. Reliability is broader. It includes not only uptime, but also consistent performance, fast recovery from failures, and predictable system behavior under varying conditions. A system can be highly available yet unreliable if it experiences latency spikes, frequent errors, or slow recovery during incidents.
3. What are the best tools to improve application reliability in production environments?
Cloud services like AWS for scalability, Kubernetes for automatic scaling, and containerization platforms like Docker are popular solutions for increasing reliability. A dependable production system also relies on tools for logging (such as the ELK Stack), monitoring (Prometheus or New Relic), and CI/CD.
4. How do blue-green deployments contribute to application reliability?
Blue-green deployments allow you to roll out upgrades without harming active users. You can switch traffic between two identical environments (blue and green) in a single managed cutover. This lowers the possibility of downtime or user disturbances by ensuring that new additions or fixes are tested in a green environment prior to going live.
5. What is the role of A/B testing and canary testing in improving production reliability?
- A/B testing helps validate new features by comparing two app versions to determine which performs better.
- Canary testing allows you to roll out updates to a small subset of customers before full deployment, so potential issues are found early without impacting all users.
Both strategies lower the risks associated with production updates.
6. What is the difference between observability and monitoring?
Monitoring uses dashboards, warnings, and predetermined metrics to track known failure modes. It provides answers to common queries like whether a service is operational or not.
By merging logs, metrics, and traces, observability delves deeper into the system. Without making assumptions, it enables teams to investigate system behavior and diagnose unidentified problems.
How Maruti Techlabs Took a Used Car Marketplace's Uptime From 90% to 99.95% With Workflow Orchestration
We collaborated with a US-based used-car marketplace with a large buyer network. The team was unable to identify errors before they affected operations because of their manually planned data pipelines, which resulted in skipped jobs, frequent initialization failures, and hard-to-trace bugs.
Our developers rebuilt the system around Apache Airflow after determining that manual orchestration was the cause of the problem. While Astronomer offered centralized visibility into the state of the Directed Acyclic Graph (DAG) and cluster health, jobs were redesigned to run in parallel rather than sequentially. The entire platform was rehosted on AWS for improved scalability and simpler maintenance, and deployments were automated by a CI/CD pipeline.
The impact:
- System availability surged from 90% to 99.95%
- Bug frequency dropped, and root-cause analysis sped up with CI/CD in place
- Automatic status monitoring identified problems before they resulted in outages that affected customers.
- Time-to-market accelerated with faster, more reliable feature delivery
Beyond execution, our DevOps and cloud engineering services cover the full lifecycle, from orchestration and CI/CD to monitoring and ongoing support, so reliability holds up as your systems and traffic scale.



